

1. Introduction
2. Data analysis and Method
2.1 Study area and weather data
2.2 Solar energy performance analysis
2.3 Validation method
2.4 Validation of typical-year electricity production
3. Results and Discussions
3.1 Statistical analysis
3.2 Errors analysis
4. Conclusion
1. Introduction
Long term weather data sets is an important factor in planning solar energy project in a given location1,2). To predict the utility-scale photovoltaic generation system, historical measured data of solar irradiance of at least ten years are recommended to be used3). In that sense, computer modelling is employed as an efficient way in long-term solar power prediction and it requires accurate and reliable weather data of multiple years to account long-term variability4). However, the variability of meteorological conditions, especially in mountain zones, makes it difficult to assess and forecast the solar resource available in a given location. In addition, the use of such data is time- consuming and expensive5). In order to reduce this problem, TMY data sets have been proposed for engineering purposes (e.g. heating, cooling, and planning photovoltaic generation plant). Furthermore, the usage of such data sets is time saving, convenient, and cheaper than the long-term weather data from weather station or satellite-data providers.
In the most recent years, there have been many methods to generate typical weather data set. Filkenstein–Schafer statistical method (TMY) is the most famous in America, whereas in Europe the Lund method (TRY) are often used6). Typical year data sets are composed of 12 typical months with 8760 hourly data sets of different weather parameters such as wind speed, temperature, and solar irradiance. Furthermore, it is generated from the long-term data sets to represent the prediction and analysis of long-term variability7). However, if hourly weather data series are missing from the data archive then they can be generated through statistical summary of hourly or monthly of data available. In addition, these interpolated data sets represent variations and errors to some extent, it is important to know that this error does not mean mistakes, and they can not be eliminated completely8,9,10,11). Therefore, the best we can do is to try to understand and quantify this error.
The typical weather data sets are crucial in designing of building energy and solar energy systems9). A number of studies have been carried out to develop TMY for local regions. Many of the previous studies listed in Table 1 focused on generating typical meteorological years in different location with different recording period and selection method (i.e. Filkenstein–Schafer statistical method, Modified Festa-Ratto method, and Argiriou models)12,13,14). However, many researchers proposed that Filkenstein–Schafer statistical method is the best method with high accuracy compared to other methods15). Furthermore, the validation of TMY has been conducted in Nigeria16), Greece17), and Thailand18); the finding showed the positive results, i.e. showed close fit agreement with the multi-year average.
Table 1.
Summary of previous studies on TMY data set
| Study |
Period of long term data sets | Location | Methods | Finding |
| Crawley (1998)5) | 1979-1988 | USA |
Filkenstein–Schafer statistical method. |
The finding illustrated that TMY2 has good representation of long-term building energy performance with deviation of annual energy consumption from –0.9% to 1.4%. |
|
Ohunakin et al. (2013)16) | 1975-2008 | Nigeria |
Filkenstein–Schafer statistical method. |
The Mean percentage error between TMY and long-term average was less than 2%. |
|
Argiriou et al. (1999)17) | 1977-1996 | Greece |
Modified Festa-Ratto method |
The deviation between TRY and the multi-year average was less than 15 %. |
|
Pattarapanitchai et al. (2014)18) | 2003-2012 | Thailand |
Filkenstein–Schafer statistical method. |
The difference between the long-term average and TMY was equal to 5 %. |
|
Yilmaz et al. (2003)19) | 1989-2012 | Turkey |
Filkenstein–Schafer statistical method. |
TMY data set were generated for each city in Turkey. |
| Skeiker (2007)20) | 1981-1990 | Syria |
Filkenstein–Schafer statistical method. |
The finding demonstrated that TMY (Sandia method) represented well the long term average of building energy with the difference of 26.2 kWh. |
|
Rahman et al. (2006)21) | 1980-1981 | Malaysia |
Filkenstein–Schafer statistical method. |
The results showed that TRYs should be generated with equal weightings of each weather variables. |
| De Miguel22) | 25 years | Spain |
Argiriou Models. |
The finding proposed a new method to generate TRY data set with root mean square error less than 5 MJm-2 compared to the long-term average of solar irradiance. |
|
Zhang (2006)23) | 1993 | China |
Filkenstein–Schafer statistical method. |
TMY data set for 57 Chinese location were generated to be used in the performance of thermal building. |
|
Pusat (2015)24) | 1989-2006 | Turkey |
Filkenstein–Schafer statistical method. |
The findings demonstrated that there is minimum percentage error less than 1% between TMY data sets and the long-term weather parameters. |
In South Korea, several TMY and TRY data sets have been produced for the major cities in recent years. The TRYs for seven Korean major cities was developed by Lee et al.13) in 2010, whereas Kim et al.14) generated TRYs for 13 cities. In other studies, weather data for 10-year period (1991-2010) in South Korea were used to derive TMY data of 10 major cities. However, these data sets are limited to 30 major cities across the country. Furthermore, the TMY data from one site are not a good indicator to capture the circumstances of other site with the different types of geographical features24).
Despite numerous studies on the development of typical data sets for different locations in South Korea, no study has focused on the annual variability of solar energy performance in multi-year period and also its effect on ratings of PV power output given by the typical years. The objective of this paper aims at filling existing research gap, through a comparison of a typical PV power output with multi-year PV power of six sites in Korea by using statistical analysis.
This research addressed three main research issues:
1) Is the TMY data set a good representation of the long- term statistical trends of PV power for six sites with different geographically conditions in South Korea.
2) How much annual variability occurs in PV power output.
3) What is the uncertainty of using TMY data set in long-term performance of solar energy projects.
2. Data analysis and Method
2.1 Study area and weather data
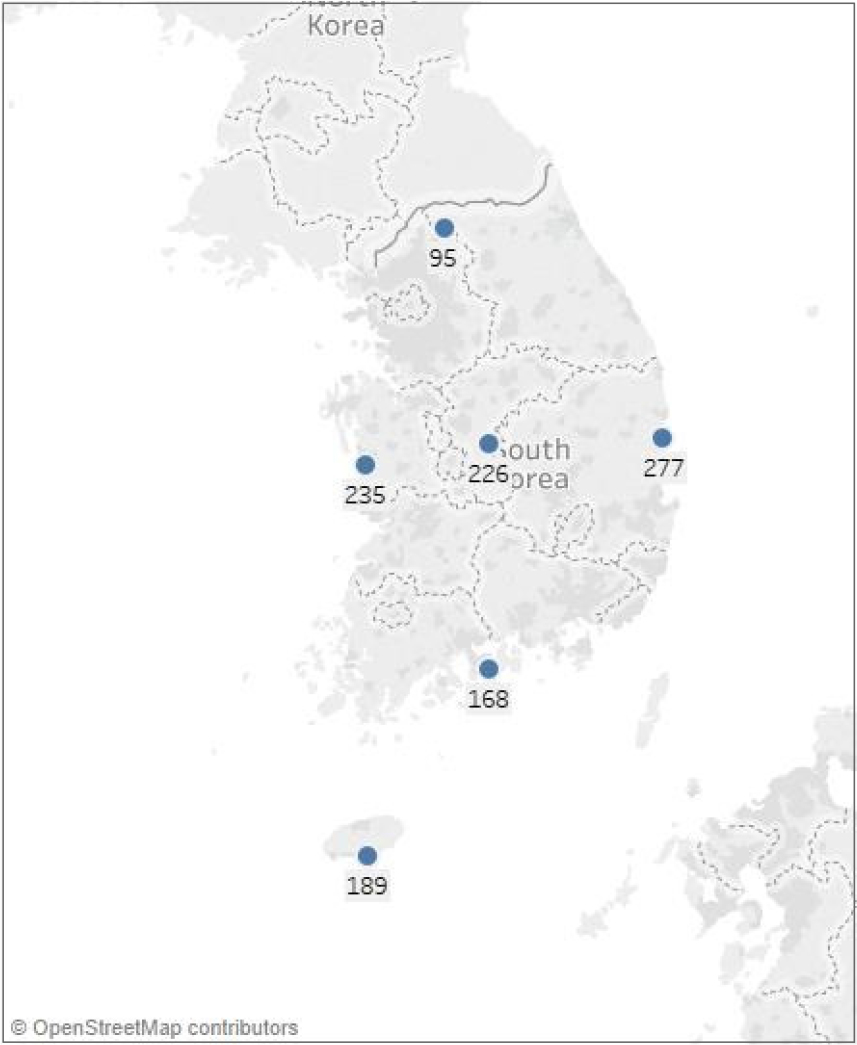
Satellite derived solar irradiance data has a critical factor in many studies in the characterization of solar resource potential25). In this study, we used Multifunctional Transport Satellite (UASIBS–KIER model) imagery from 2008 to 2017 (satellite derived irradiance data) to analyze accuracy of TMY data sets. In addition, the validation of this satellite solar irradiance has been conducted based on ground measurement solar radiation, the finding showed that there was minimum error less than 5.3% between satellite solar radiation and clear sky solar irradiance26). The other weather parameters such as temperature, wind speed were obtained from Korea Meteorological Administration, whereas TMY data (Sandia method) were processed by the Korea Institute of energy research. Furthermore, TMY data were generated from long term weather data (2008-2017). Table 2 presents the summary of long term data sets for the six sites in South Korea. In this research, the six sites were chosen to validate the TMY data set and to analyses the effects of geographical variability and topographically features in solar systems, because they receive very different amount of annual solar radiation. The Fig. 1 presents the study area with their code.
Table 2.
Information for data set used in this study
2.2 Solar energy performance analysis
In this study, the validation of the TMY for the South Korea was carried out by using computer simulation, PVSyst software was used to predict the long-term performance of PV power output by using TMY and long-term data set. The accuracy of the PVsyst has been carried out based on measured PV energy yield and simulated PV power solar radiation, the deviation of PV energy yield and simulated PV power solar radiation are in range of 4% to 8%27). The long-term weather data sets such as solar irradiance, ambient temperature and wind velocity from 2008-2017 and TMY datasets were used as input parameters in PVsyst software to estimate the long-term PV power output. In this research, solar energy performance were evaluated as total PV power produced by a 100 kW system, 30-degree tilt, on a fixed tilted plan array, oriented on 0 degree azimuths. The long-term PV power output was regarded as reference value for the validation of TMY-PV power output. Furthermore, the TMY annual energy results are compared to the multi-year electric power output. Fig. 2 presents the flowchart used to validate the PV power output for TMY, whereas Table 3 presents the characteristics of the PV module, inverter, and the system-design parameters employed for the solar energy performance in the study area.
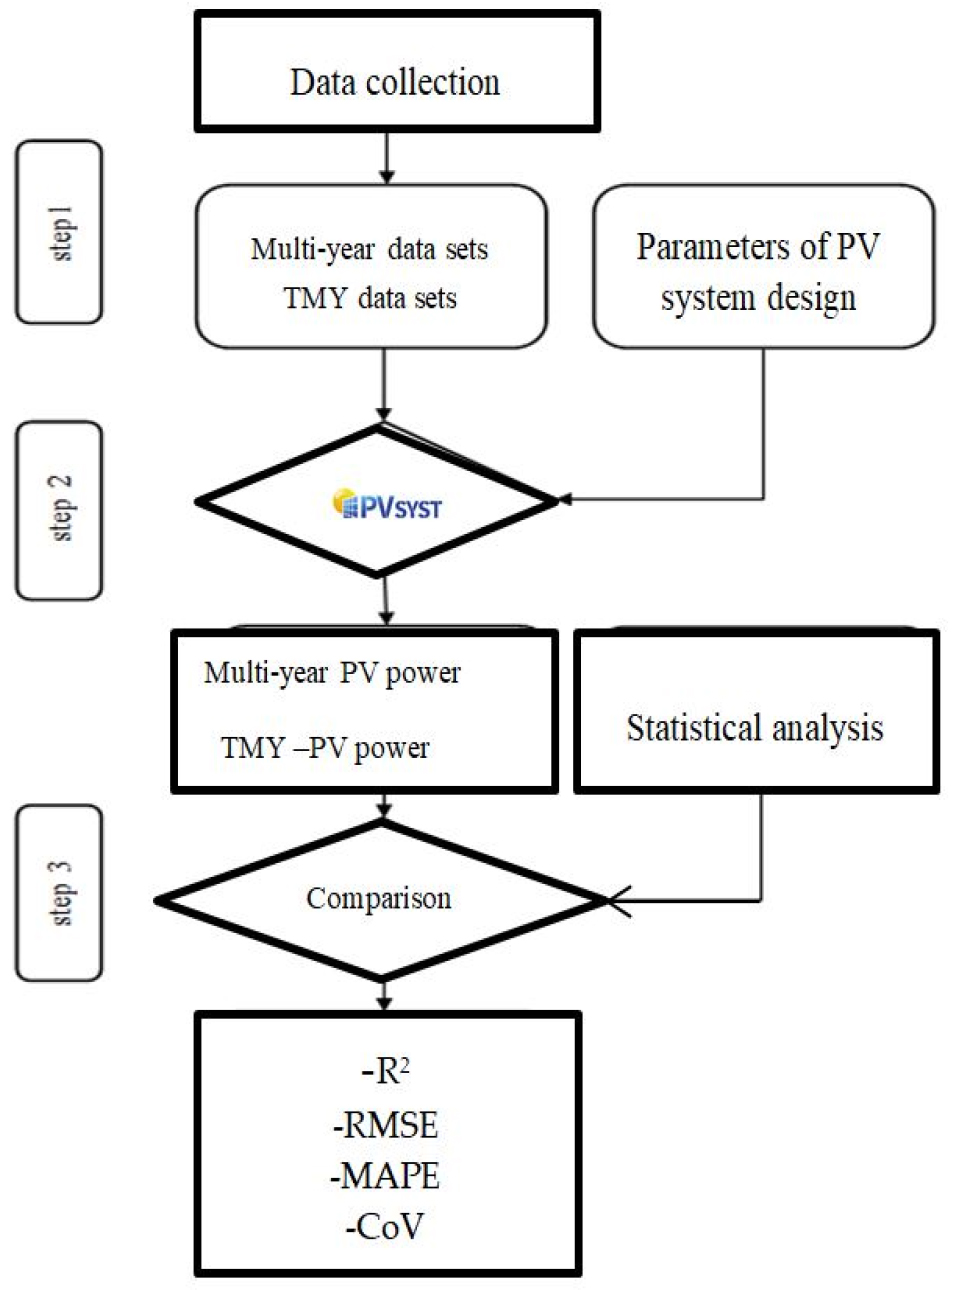
Table 3.
Parameters of PV system design for PVsyst simulations
2.3 Validation method
Inter-variability was carried out to understand the variability inherent in the PV power output quantitatively. Monthly average values of TMY PV power output were compared to the distributions of the averages in the long-term series, which are described by first and third quartiles, and average. The closer TMY-PV power output to the multi-year average for a given month, the better. A representativeness problem can be identified when TMY monthly average PV power output is outside the interquartile range (IQR). In addition, coefficient of variation metric (CoV) was used to underscore the deviation between TMY and long-term average PV power output in each month. This technique has been applied in Australian, Kenya to characterize the inter-annual variability of hourly solar radiation from 1995-201628,29).
Where n indicates the number of data used whereas indicates, TMY monthly average of PV power output, and indicates long-term monthly average of PV power output.
2.4 Validation of typical-year electricity production
Errors metric were used as measure of how close TMY data sets are to the long –term average PV-power output. In this study, root-mean-square error (RMSE), coefficient of correlation (R2), and mean absolute percentage error (MAPE) were used to examine the performance of TMY. In particular, R2 was used to measure the association between long-term electricity production and typical-year electricity production, RMSE indicates the extent concentration of typical-year electricity values around long-term electricity production, and MAPE represents size of errors in percentage30,31).
The formulas are presented as follow:
Where n indicates the number of data used whereas indicates, TMY monthly average of PV power output, and indicates long-term monthly average of PV power output.
3. Results and Discussions
3.1 Statistical analysis
The TMY and multi-year PV power output were predicted by using PVsyst software. This simulation tool are very useful to run analysis with different data sets, it allows the user to export the data from the program to an editable Excel file. Table 4 presents the results of typical-year monthly electricity production and the distributions of monthly average of multi-year PV power output (minimum, maximum, mean, quantiles) and the deviation between TMY monthly PV power output and long-term average (CoV), the monthly PV power output were computed by average of hourly PV power output in that month. Analyzing the PV power monthly variability, it is clear that the TMY values are between the upper quartile Q1and the lower quartile Q3 in most of the cases, indicating that TMY data is good with great accuracy, however, due to the different months and locations, different behaviors can be observed in some cases. In addition, the TMY monthly average PV power output are quite similar to average values of the long term period. This shows that these TMYs are an appropriate tool for long term solar performance analysis. However, even if typical annual energy were compared in six sites, it can be seen that the results are different because of geographical variability and topographically features. For instance, considering the PV power output in Boryoung only July, September and November are inside the interquartile range while in Chulwon only January, February and May are outside the interquartile ranges.
Table 4.
Statistics for the PV power output in six sites from 2008 to 2017
Table 5 presents the percentage of change (%) between TMY and monthly average PV power output of long-term. The result showed that deviations between the TMY and the long term mean are -3.7 to 15.51 % for Boryoung, -13.97 to +10.42 % for Chulwon, −25.91to 18.26% for Seoguipo, -13.2 to 16.53 % for Yeosu, -8.79 to 11.83% for Boeun, and −22 to 8.86 % for Yeonduk. The deviation of the PV power output is very different in each location; however, in all sites there are overestimations and underestimation of the energy calculated by TMY. In Boryoung, the monthly average of January, February, March, April, May, August, October, December are significantly lower than long –term average electricity output while in Yeongduk March, April, September, December are overestimation as it can be noticed in Table 5. Furthermore, it can be observed that the typical-year electricity production is under-predicted in winter than in summer. This shows that TMY performance may be significantly affected by inter- season variability. However, this data set was limited to 10 reference year.
Table 5.
Percentage of change (%) between the TMY (kWh) and the monthly average electricity output of long-term (kWh)
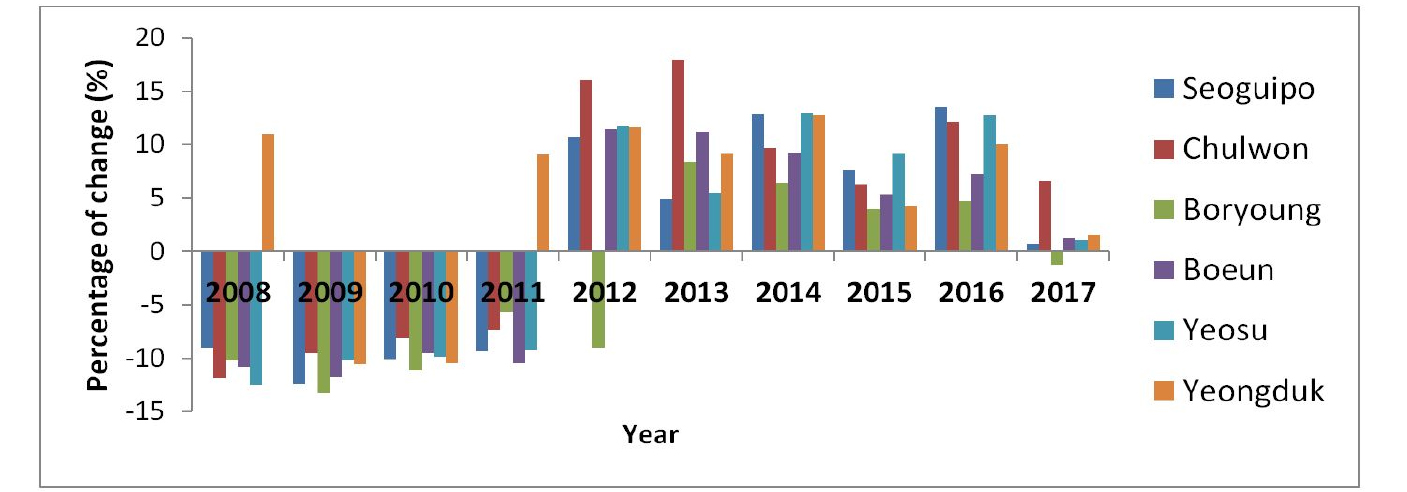
In order to address long-term variability of PV power output due to the weather conditions, the percentage of change between total annual of long –term PV power output and TMY were carried out. The y-axis indicates the annual percentage of change in the annual PV power output when compared to the TMY. The x-axis indicates the time series of the multiyear PV power output. The yearly variations in PV power output from 2008 to 2017 are shown in Fig. 3. In some site such as Boryoung, Boeun, and Yeosu, the yearly PV power output mostly changed from the TMY by less than 15%, while in Chulwon (high mountains areas), the variation were up to 18% because of orographic effect. For that problem, the high mountain is the source of the clouds: as the moist air is forced over the mountain, the water condenses, forming clouds. Therefore, these clouds are primary route for water to the rain, the effect of cloudiness results in less solar radiation on this site, and increased variability overall as shown in Fig. 3. TMY has negative variation in early years in almost all the sites, and the positive variation was observed in recent years.
3.2 Errors analysis
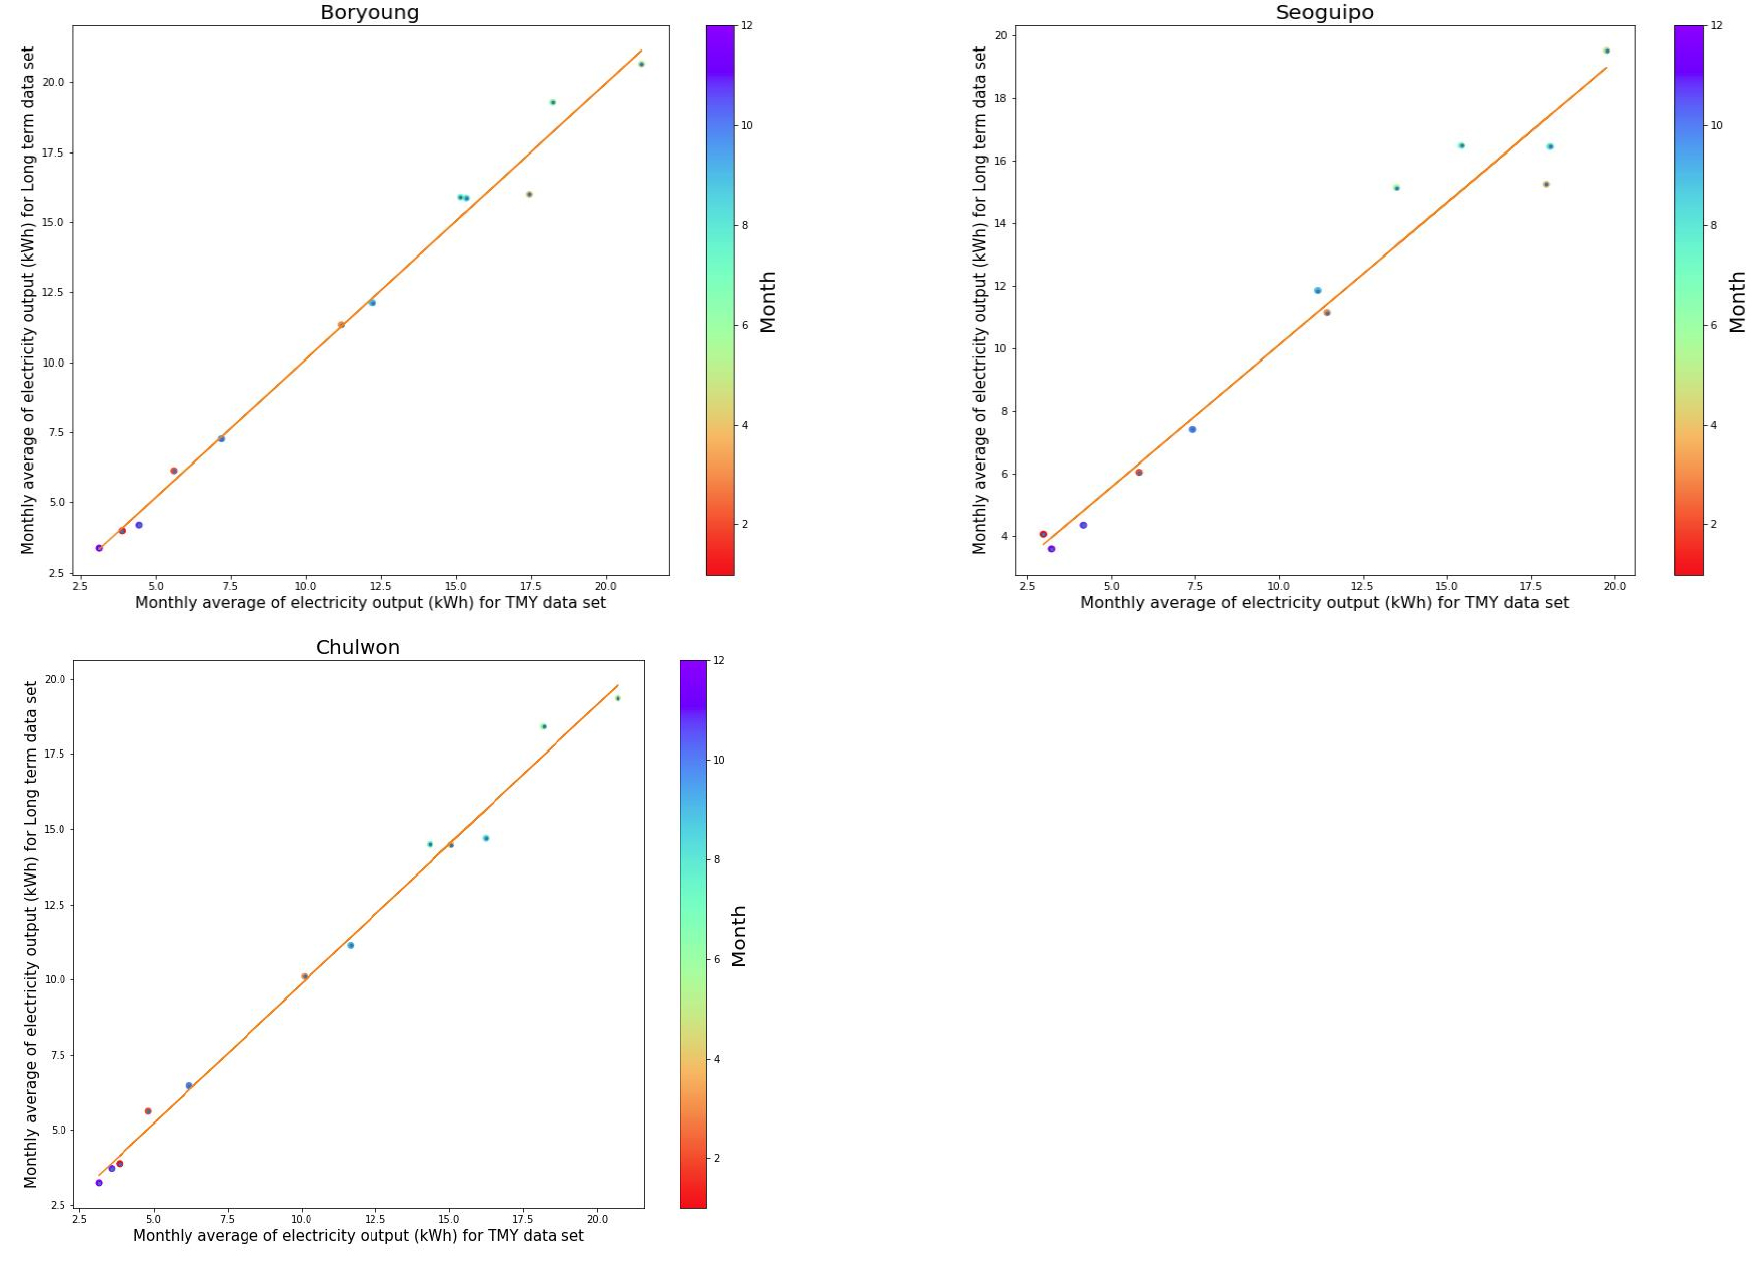
Fig. 4 illustrates that there is excellent relationship between the monthly average of PV power output for TMY and long-term mean of PV power output, the mostly monthly average points are closed to reference line. Furthermore, the bigger difference in PV power outputs can be observed in summer and spring. The correlation coefficient values between the monthly average of PV power output for TMY and long-term data sets are very high (Table 6). Especially high value of this coefficient is observed in Boryoung site compared to the other sites. The calculation results of the RMSE, R2, and MAPE for PV power output of TMY and long-term average PV power output are presented in Table 6. RMSE value here shows the monthly average of the difference between the monthly average of PV power output for TMY and the long-term average PV power output. In this study, the calculated %MAPE values indicate that it is possible to estimate the monthly PV power output for TMY with an error of less than 9% using the PVsyst-based simulation without the long-term data. In addition, RMSE (MWh /month) calculated in these studies varies from 0.6283 to 1.178. That means, there is a small error in monthly average between typical-year electricity production of 100 kW capacities and long-term electricity production. These results demonstrate that the TMY data set could be used to evaluate the long –term PV generation. In practice, MAPE of 15% and RMSE of 5 % might be a reliable level of estimation16). In this case TMY data set can be used as good substitute of multiyear data sets. Our TMY data sets are closest to the multiyear average according to the previously mentioned result of RMSE and MAPE. Significantly %MAPE calculated in other studies varies from 12% to 2.23% in Nigeria16), while in Beijing32) equals 4%.
4. Conclusion
In this research, long term representation of a typical year and multiyear data series (10 years) were collected for 6 sites in South Korea with different topographical and geographically conditions. Furthermore, the accuracy of the TMY data sets was evaluated by comparing it to 10 year actual historical PV power output by using the statistics analysis, by setting up a 100 kW solar system in the PVSyst software, the evaluation metric between the TMY and long term average PV power output were also analyzed.
The key findings of the research are organized as follows:
(1) The PV power output varied greatly from year to year due to different topography of six sites. The variation was more significant in Chulwon site (high mountain area).
(2) The TMY simulations tended to underestimate or overestimate the PV power output. Furthermore, the deviation between TMY and average monthly of multiyear is not the same in all sites.
(3) TMY data sets are proper in various geographical and topographical conditions in South Korea. In addition, the TMY data set for all sites showed a close-fit to long-term average PV power output. A good alignment between long term average PV power output and TMY presents a good representativeness of the solar energy performance in South Korea.
These findings imply that Korean policymakers, solar project planners, developers, financiers should use these TMY data sets in long term prediction of PV power output to reduce computation work and to save time. Furthermore, this study employed 10-year data set as a limitation, in the future, if data are more than 30 years, it would be useful to compare TMY data set and long –term data set average to identify the effect of inter-annual variability and climate change.
