

1. Introduction
2. Research Methods
2.1 System description and existing facilities
2.2 Process design of the P2H-TES thermal network
2.3 Process modeling environment and simulation setup
2.4 Model validation
3. Results and discussion
3.1 TES charging and direct supply performance
3.2 Stratification behavior and cascade operation
3.3 Load coverage
3.4 Heat-pump and fuel cell performance
4. Conclusion
Symbols and Abbreviations
ASHP : Air source heat pump
COP : Coefficient of performance
DR : Demand response
DH : District heating
FC : Fuel cell
HTHP : High temperature heat pump
HX : Heat exchanger
LF : Length fraction
MTHP : Medium temperature heat pump
P2H : Power-to-heat
PCM : Phase change material
TES : Thermal energy storage
T : Temperature
VRE : Variable renewable energy
1. Introduction
Decarbonizing heating systems in buildings remains a major global challenge. In recent years, photovoltaic (PV) and wind power technologies have advanced rapidly, making renewable electricity increasingly affordable1,2). However, heating sector still accounts for approximately 50% of the global final energy consumption, with more than 70% supplied by fossil fuels3,4). As a result, integrating renewable energy sources into thermal networks has become a growing focus in both academic research and industrial applications. With the high penetration of variable renewable energy (VRE) sources like PV and wind, their production often needs to be curtailed, which refers to the deliberate reduction of VRE output due to overproduction, system inflexibility and grid congestion5). Therefore, to improve building level energy self-sufficiency, power-to-heat (P2H) systems, in which electricity is converted to thermal energy through heat pumps or electric boilers with smart use of thermal energy storage (TES) have emerged as an effective strategy to reduce curtailment, decrease fossil fuel dependence and limit electricity imports from grid during peak price periods6).
In South Korea, the importance of P2H and TES has increased due to evolving national energy policies. The 10th basic plan for electricity supply and demand (2023) emphasizes demand side flexibility, electrification of heating and reduction of renewable curtailment7). The carbon neutrality roadmap targets a 32.8% reduction in CO2 emissions from the building sector by 2030, highlighting the critical role of thermal network solutions integrating P2H-TES and renewable energy8). However, existing research on P2H–TES systems typically rely on simplified TES models and fixed COP values, neglecting stratification and dynamic interactions. For instance, Mehleri et al. (2012)9) developed an optimization framework for distributed energy systems without incorporating thermal energy storage, while Cedillos Alvarado et al. (2016)10) proposed a technology selection and operation model integrating combined heat and power (CHP) and organic Rankine cycle (ORC) systems, yet excluded TES from their analysis. Similarly, Schütz et al. (2017)11) analyzed PV-heat pump retrofit scenarios without considering interactions among multiple thermal technologies. Furthermore, demand response (DR), a mechanism that allows buildings to adjust their electric loads based on grid conditions (e.g., increasing load during surplus power [+DR] or reducing load during shortages [–DR] is rarely incorporated into existing P2H-TES models, resulting in limited operational flexibility12). To address these gaps, this study develops a TRNSYS-based thermal network model that integrates fuel cell waste heat, multiple heat pumps (ASHP, MTHP, HTHP) and a stratified TES for building clusters. Unlike previous studies, this work evaluates dynamic multi-mode system operation under representative seasonal load conditions and implements a control strategy that reflects DR signals (+DR/–DR). The findings are expected to support the development of P2H based distributed energy systems that enhance renewable energy utilization, reduce curtailment, and enable economically efficient thermal management for the building sector.
2. Research Methods
2.1 System description and existing facilities
The study was conducted for the multi-building thermal energy system located at Korea District Heating Corporation Miraegaebalwon site in Yongin city, which currently operates a diverse mix of thermal and electrical technologies. The existing network includes electricity supply by KEPCO, a 105 kW phosphoric acid fuel cell (PAFC) system, a 216 kW rooftop parking photovoltaic (PV) system and district heating supply supported by a 116 kW fuel cell heat recovery unit. Additional onsite facilities include a 17 kW organic Rankine cycle (ORC) generator, an absorption chiller and an extensive network of underground heat transfer pipelines. These pipelines interconnect multiple buildings and interface with the district heating (DH) network, enabling bidirectional thermal energy exchange (import and export) depending on operational conditions and seasonal demand.
The site consists of office, research and residential buildings with variable thermal demand profiles. In the current configuration, fuel cell waste heat utilized for domestic hot water supply, while space-heating demand is met by district heating network. However, the system lacks operational flexibility for P2H, peak load management, and currently recovers only about 40% of the available fuel cell waste heat, while the remaining portion is rejected due to limited thermal demand and operational constraints. The waste heat recovery efficiency was determined from measured operational data as the ratio of recovered thermal energy to the total available fuel cell waste heat output (116 kW). Although a phase change material (PCM) unit is installed onsite, it is not integrated into operational control strategy. Consequently, the implementation of a P2H–TES based thermal network is required to enhance renewable energy utilization, reduce dependence on district heating, and enable grid supportive functions such as demand response. Dynamic transient simulation is therefore essential to capture real time interactions among the TES stratification, heat pumps, PCM, the fuel cell, and multi-building thermal loads. This framework supports the development of a flexible, low carbon thermal network aligned with future electrification and decarbonization goals.
2.2 Process design of the P2H-TES thermal network
Fig. 1 presents the process diagram of the integrated P2H–TES thermal network developed for the site based on the existing infrastructure. The system integrates multiple power-to-heat (P2H) devices, a stratified thermal energy storage (TES) tank and a phase change material (PCM) unit to overcome current limitations of operational flexibility and waste heat utilization. The TES is a vertical cylindrical tank with a total storage volume of 32 m3 and a height of 6 m, operating as a sensible heat storage system using water as the storage medium. The TES is discretized into eight vertical nodes and is operated within a temperature range of 35 – 75℃. The initial state of charge (SOC) for the analyzed scenarios corresponding to a fully charged condition at top-node temperature 75℃ unless otherwise specified. The PCM unit has a specified latent heat storage capacity of 244.8 Mcal (284.7 kWh). Two air-source medium temperature heat pumps (MTHPa), each with a rated heating capacity of 70 kW and a rated electrical input of 23.3 kW (rated COP ≈ 3.0, mass flow rate = 3.3 kg s-1), together with an on-site fuel cell are used to charge the TES. Fuel cell waste heat is delivered through an immersed heat exchanger coil located in the lower nodes of the TES (mass flow rate =1.17 kg s-1). For load supply, a medium temperature heat pump (MTHP) and a high temperature heat pump (HTHP), each with a rated heating capacity of 300 kW and a rated electrical input of 100 kW (rated COP ≈ 3.0, mass flow rate = 10.2 kg s-1), draw thermal energy from the top node of the TES to deliver hot water at 75 – 80℃ and 80 – 100℃, respectively, for building heating demand and district heating export. In the schematic, red lines denote hot water supply, while blue lines indicate return flow.
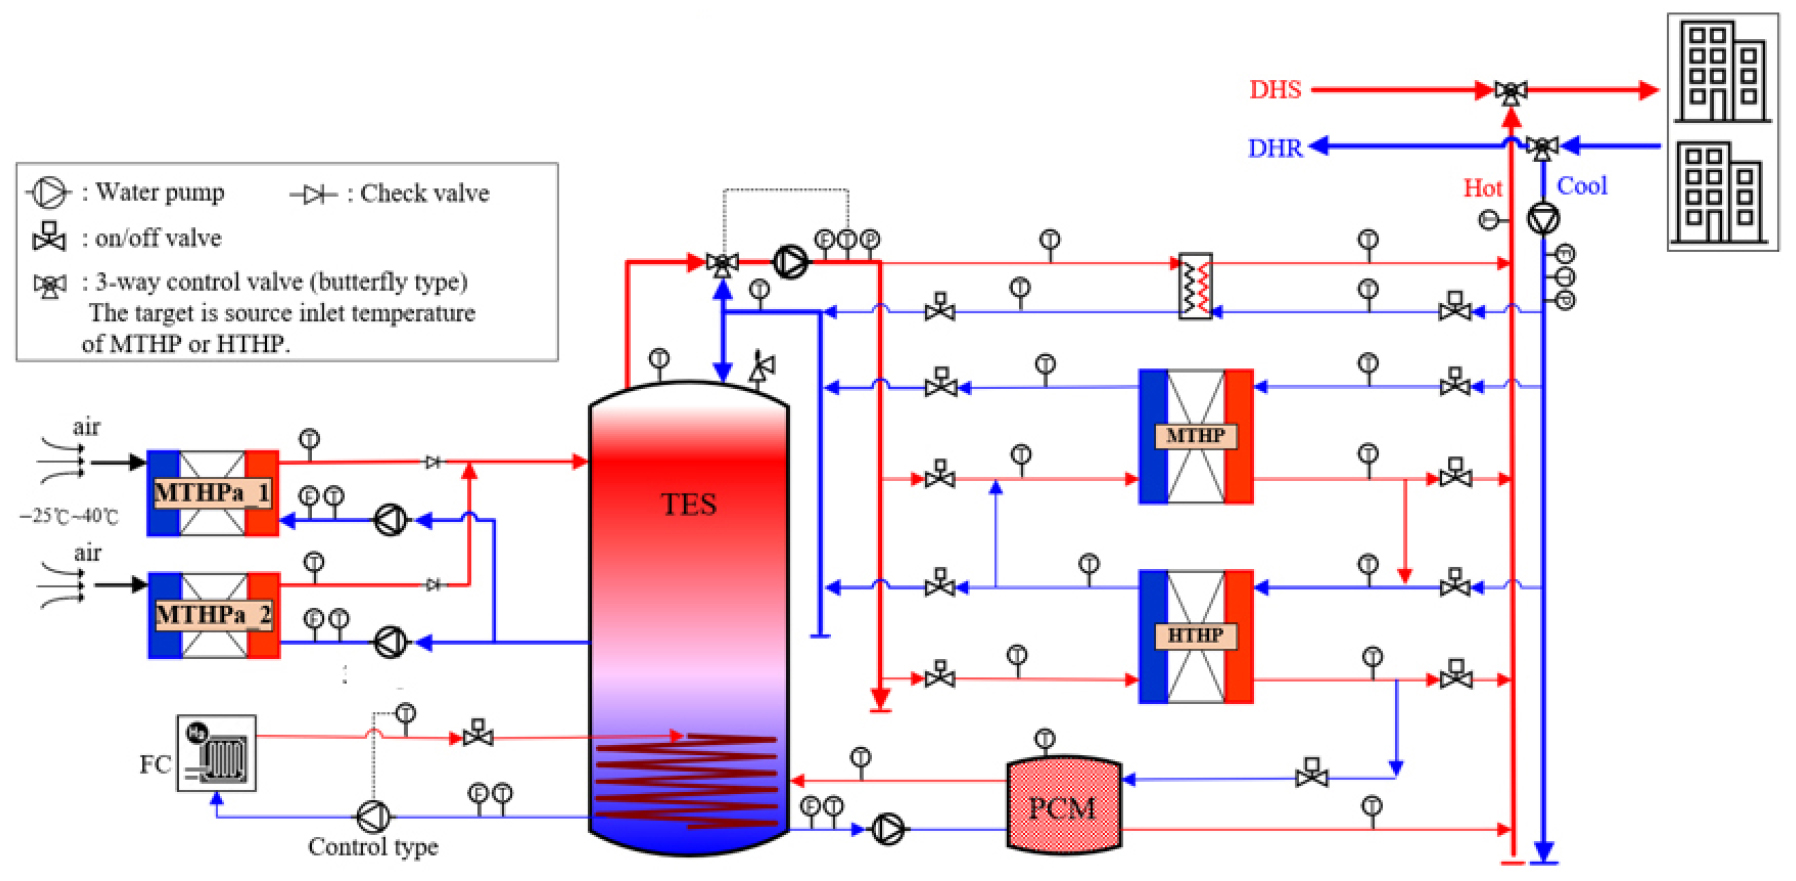
System operation varies according to TES temperature, grid status, and thermal demand. Under +DR conditions, surplus electricity is utilized to charge the TES via MTHPa units. During -DR events, thermal demand is met directly from the TES through a dedicated heat exchanger (HX) to minimize electricity consumption. Cascade operation is activated when a +DR signal is present or when the thermal load exceeds 300 kW, resulting in the simultaneous operation of the MTHP and HTHP. In parallel operation, a single heat pump is selected based on the TES temperature and the required supply temperature. The MTHP is enabled when TES top-node temperature lies within 35 – 40℃, while the HTHP is activated when TES top-node temperature exceeds 40℃. The PCM unit, thermally coupled to the TES, provides additional buffering by storing excess heat during charging and release it during peak demand, thereby stabilizing TES temperature and reducing cycling of heat pumps. In the proposed configuration, thermally coupled refers to a dedicated water loop between the TES and the PCM, in which HTHP extracts water from upper layers of the TES and heats it above 80℃ to charge the PCM, after which the PCM loop supplies hot water to TES at approximately 78℃ during discharge. However, the PCM unit is not modeled in the present TRNSYS simulations and is therefore considered only at the conceptual design level. These integrated interactions make the system adaptable to variable thermal loads, renewable energy availability and demand response events.
2.3 Process modeling environment and simulation setup
For the evaluation of the developed P2H–TES thermal network, TRNSYS-18 was selected as the primary simulation platform, as it provides modular component libraries, flexible control implementation, and has been extensively validated for thermal system analysis at the district scale13).
Table 1 summarizes the TRNSYS components types adopted in this study, including the fuel cell (Type 170a), stratified energy storage tank (Type 534), heat pumps (Types 941 and 927), heat exchanger (Type 5b), and building load model (Type 682). Supervisory control logic, encompassing TES charging and discharging decisions as well as multi-mode operation, was implemented using TRNSYS equation blocks, allowing for the dynamic assessment of integrated thermal network performance under varying operating conditions.
Table 1
TRNSYS component types used in the P2H-TES thermal network simulation
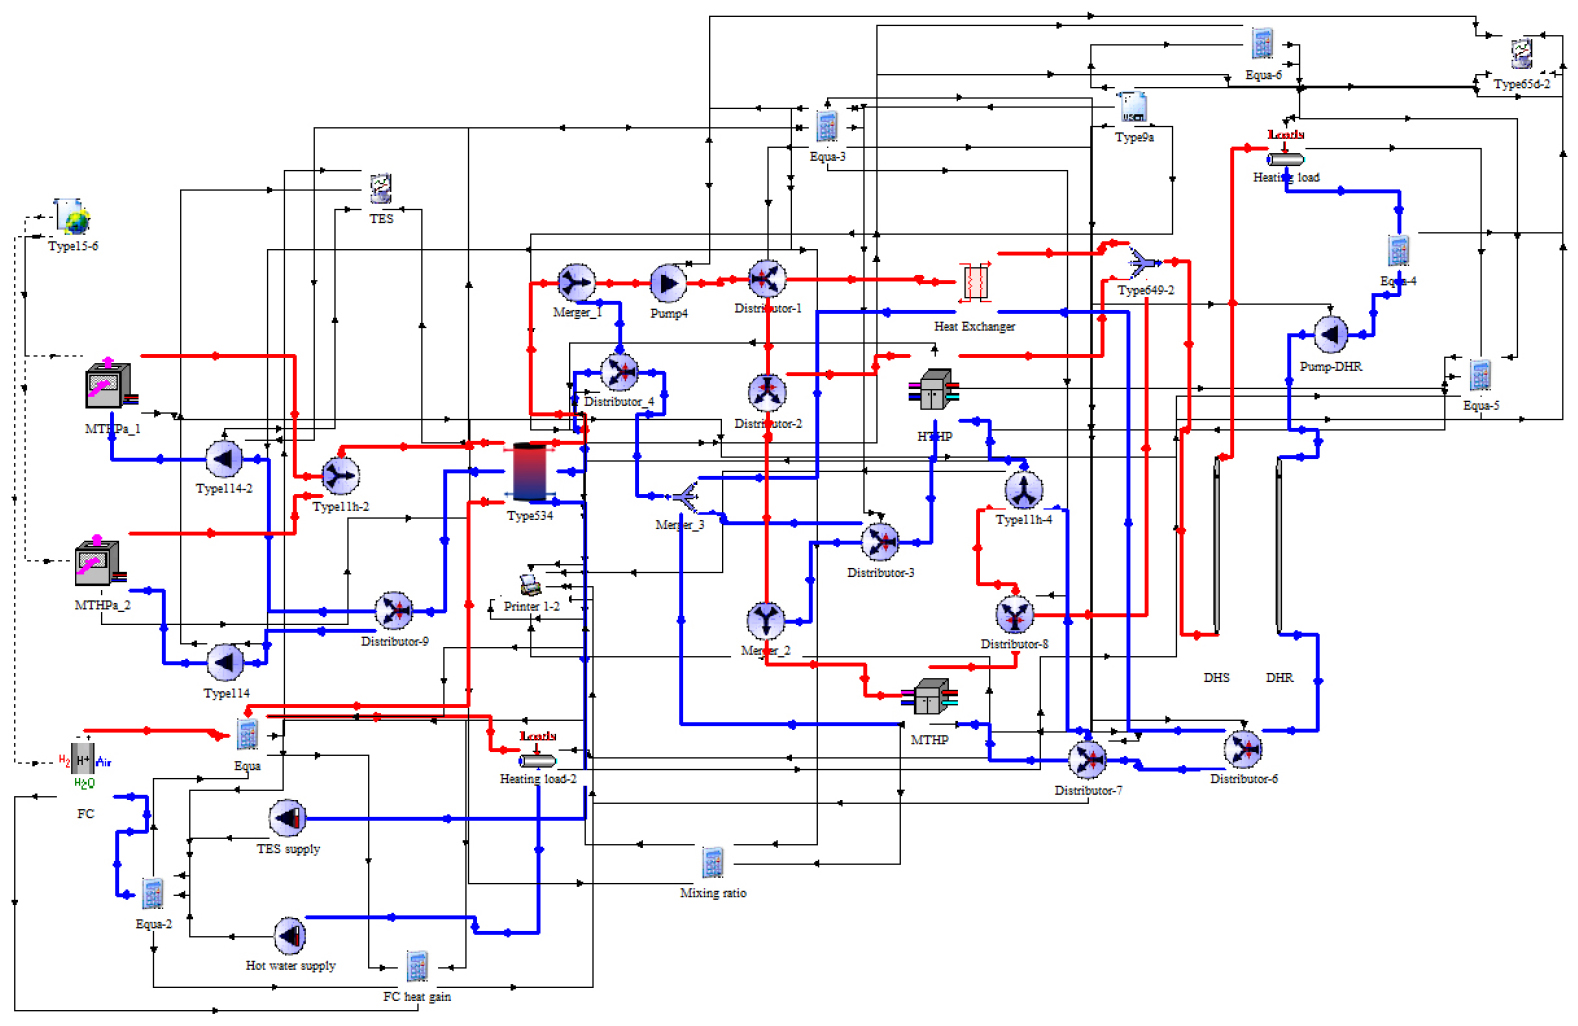
(1) TRNSYS studio model configuration
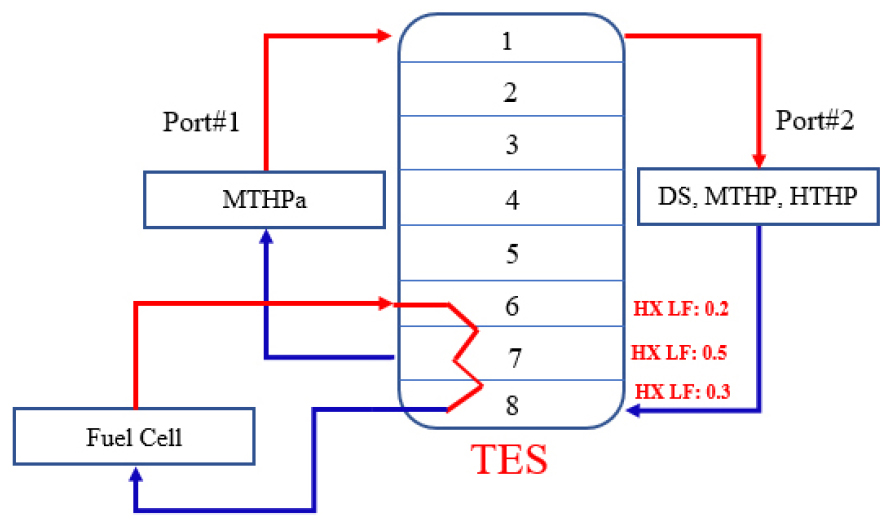
Fig. 2 presents the complete thermal network model developed in TRNSYS studio, integrating the TES charging devices (MTHPa and fuel cell), the stratified TES module, load side heat pump units, and the district heating import and export interface. To represent thermal stratification within the TES, the storage tank is discretized into eight temperature nodes, each representing a vertically stacked control volume characterized by a uniform temperature and mass. Fig. 3 illustrates the arrangement of nodes in the TES and the corresponding port assignments. The ports specify the positions at which charging and discharging flow streams enter and exit the tank. The MTHPa units charge the upper TES node through port 1, while load side heat pumps and direct supply operation extract heat through port 2 from same upper TES node. Fuel cell waste heat is delivered through an internal immersed coil heat exchanger spanning TES nodes 6 – 8, with length fraction ratios of 0.2, 0.5, and 0.3, respectively, which define the distribution of coil length and heat transfer area across these nodes.
(2) Initial and boundary conditions
The initial and boundary conditions were defined to reflect realistic site operation. Climate data for the simulation were obtained from the standard meteorological year (TMY) dataset for Seoul, South Korea, including solar irradiance and ambient temperature. To analyze the P2H–TES system operation, two operating conditions were considered. First, normal operation was simulated by applying the representative winter-week load profile shown in Fig. 4 as the boundary condition, without imposing any demand response (DR) events, in order to evaluate baseline system performance and control behavior. Second, direct supply operation (–DR) was evaluated by applying a constant thermal load of 300 kW to assess the system’s ability to sustain load supply during periods of restricted electricity availability. Although +DR events were not activated in the simulations, actual +DR events did occur in South Korea in 2024 (10 events over 21 operating hours, with and aggregated energy participation of 7,187 MWh), demonstrating the practical relevance of the proposed system14).
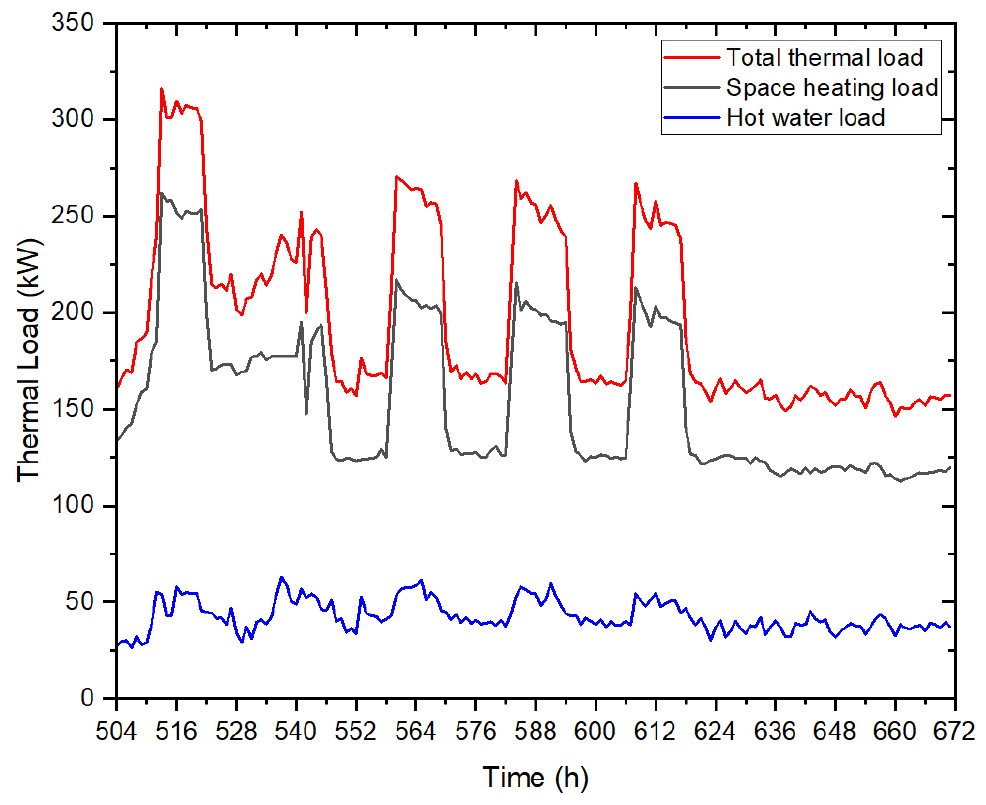
The winter week load profile comprises total thermal demand, space heating load, and domestic hot water demand derived from full-year (2024) measurements of a thermal energy system serving research and residential buildings at Korea District Heating Corporation Miraegaebalwon site in Yongin city, South Korea. The data were recorded at 1-minute intervals during normal operation. During direct supply operation, the TES top-node temperature was constrained within the 55 – 75℃ range, reflecting the minimum temperature required to meet the building heating demand. Heat losses were neglected in both direct supply and winter-week load operation conditions. The fuel cell was assumed to operate continuously, with recovered waste heat directed either to domestic hot water supply or to TES charging once the TES top-node temperature dropped below 65℃. Although a 216 kW photovoltaic (PV) system is installed at the site, it was not included in the present simulations, as this study focuses on the thermal network dynamics and control performance under representative load conditions. Under these conditions, the TRNSYS model captures the dynamic coupling among TES stratification, heat pump cycling, and realistic load variability.
2.4 Model validation
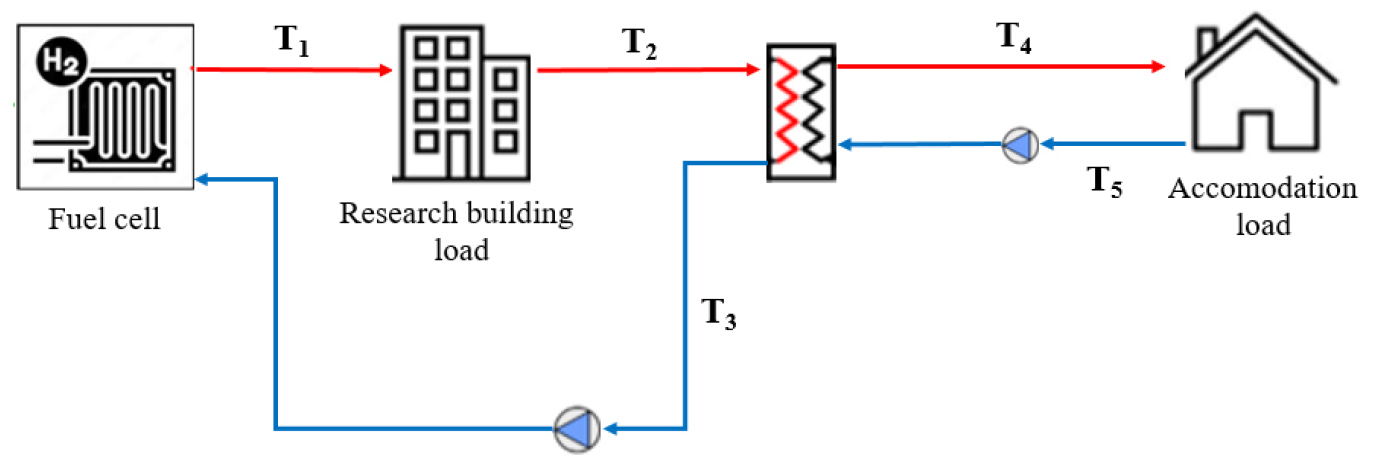
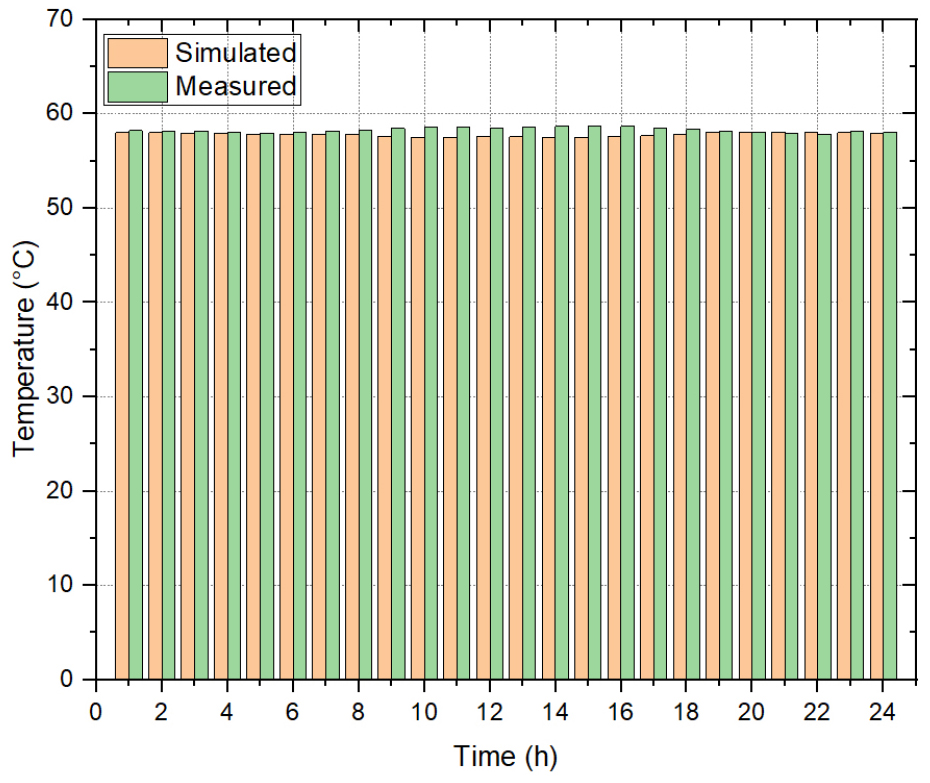
To validate the simulation framework before applying it to the developed P2H–TES network, the existing fuel cell–based hot water supply system was first modeled in TRNSYS. Simulated temperatures were compared with measured data at key monitoring points within the current fuel cell network (T1 – T5) as illustrated in Fig. 5. The measured data were obtained from the building energy management system (BEMS) of a multi-building thermal energy systems located at the Korea District Heating Corporation Miraegaebalwon site in Yongin city, South Korea, with temperatures recorded at 1-minute intervals during normal operation. The fuel cell supplies hot water first to the research building, and subsequently to the accommodation facility via a heat exchanger, with the return flow monitored at T3. Fig. 6 compares the simulated and measured T2 temperatures for one-day period. The simulated profile closely matches the measured trend, yielding a mean bias error (MBE) of 0.18 and root mean square error (RMSE) of 0.66. The MBE quantifies the average deviation between simulated and measured values, while RMSE represents the magnitude of overall error. Similar levels of agreement were observed for the other monitored temperature points confirming that the model accurately captures the thermal behavior of the existing fuel cell network.
3. Results and discussion
The results demonstrate that the proposed multi-mode control strategy enables smooth transitions among TES charging, discharging, direct supply, and cascade operating modes in response to real-time thermal load conditions.
3.1 TES charging and direct supply performance
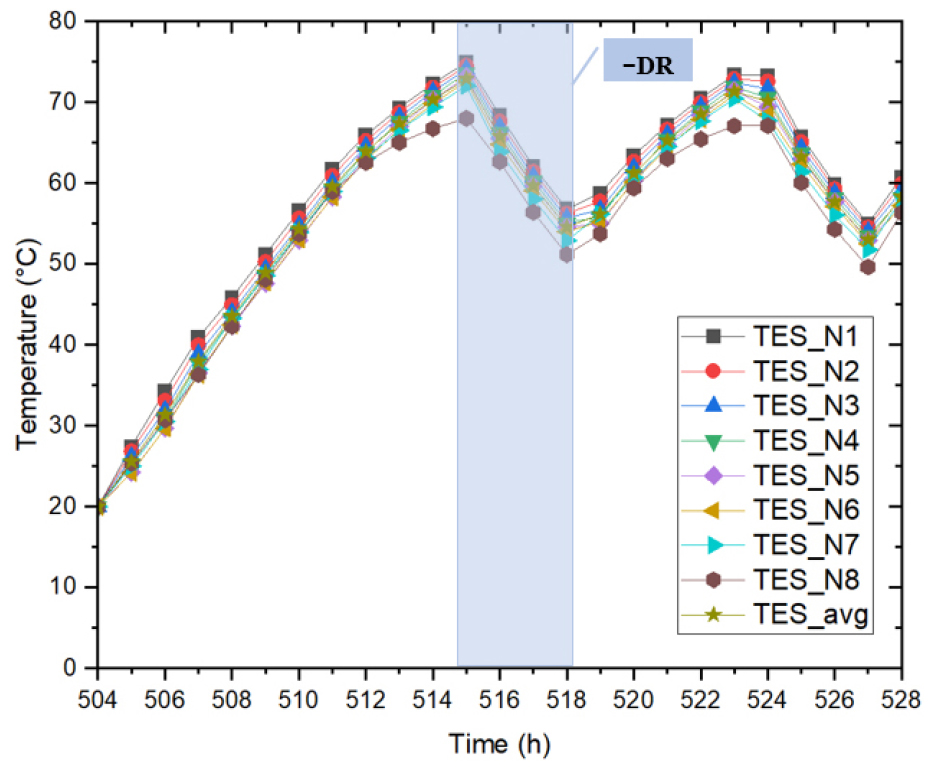
Fig. 7 illustrates the TES temperature evolution under direct supply operation. During the charging phase, the TES temperature increased from 20℃ to 75℃ within approximately 12 hours, indicating sufficient charging capability from the combined input of the MTHPa units and fuel cell waste heat. Under direct supply mode (–DR event, with no heat pump activation), the TES was able to sustain a constant thermal load of 300 kW for nearly 3 hours, which is consistent with typical –DR event duration. Throughout this period, the TES top-node temperature remained within the prescribed control band (55 – 75℃), indicating stable stratified discharge during direct heat supply.
3.2 Stratification behavior and cascade operation
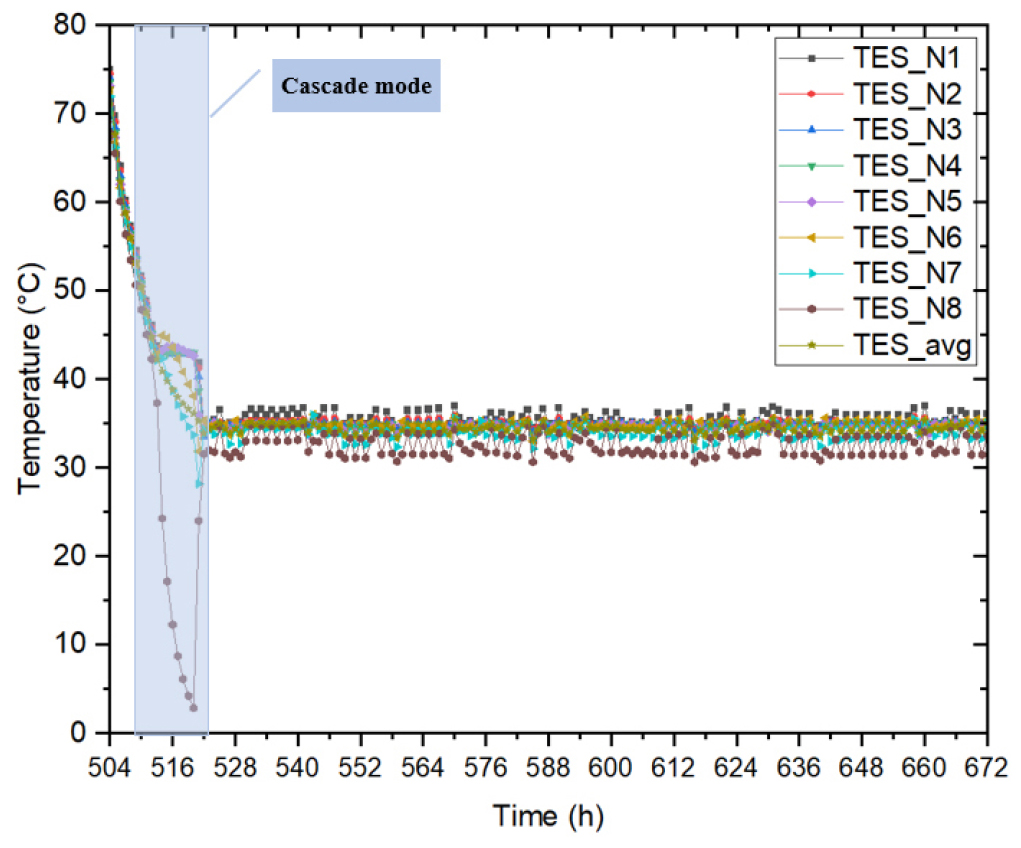
TES stratification maintained throughout the simulation as shown in Fig. 8. Over the analyzed period, a persistent temperature gradient between the top and bottom node was observed, with no temperature inversion between adjacent nodes, confirming stable thermal stratification. A temporary temperature dip occurred in the lowest layer (Node 8) when the system entered the cascade operation under high thermal demand (>300 kW). During cascade operation, the simultaneous operation of the MTHP and HTHP increased the cooling demand on the source side, thereby reducing the MTHP outlet temperature. The resulting colder return flow entered the lower TES nodes, causing a short-lived disturbance in stratification. Once the cascade period ended, the TES temperature profiles rapidly re-stabilized, demonstrating the robustness of the TES stratification under transient high load conditions.
3.3 Load coverage
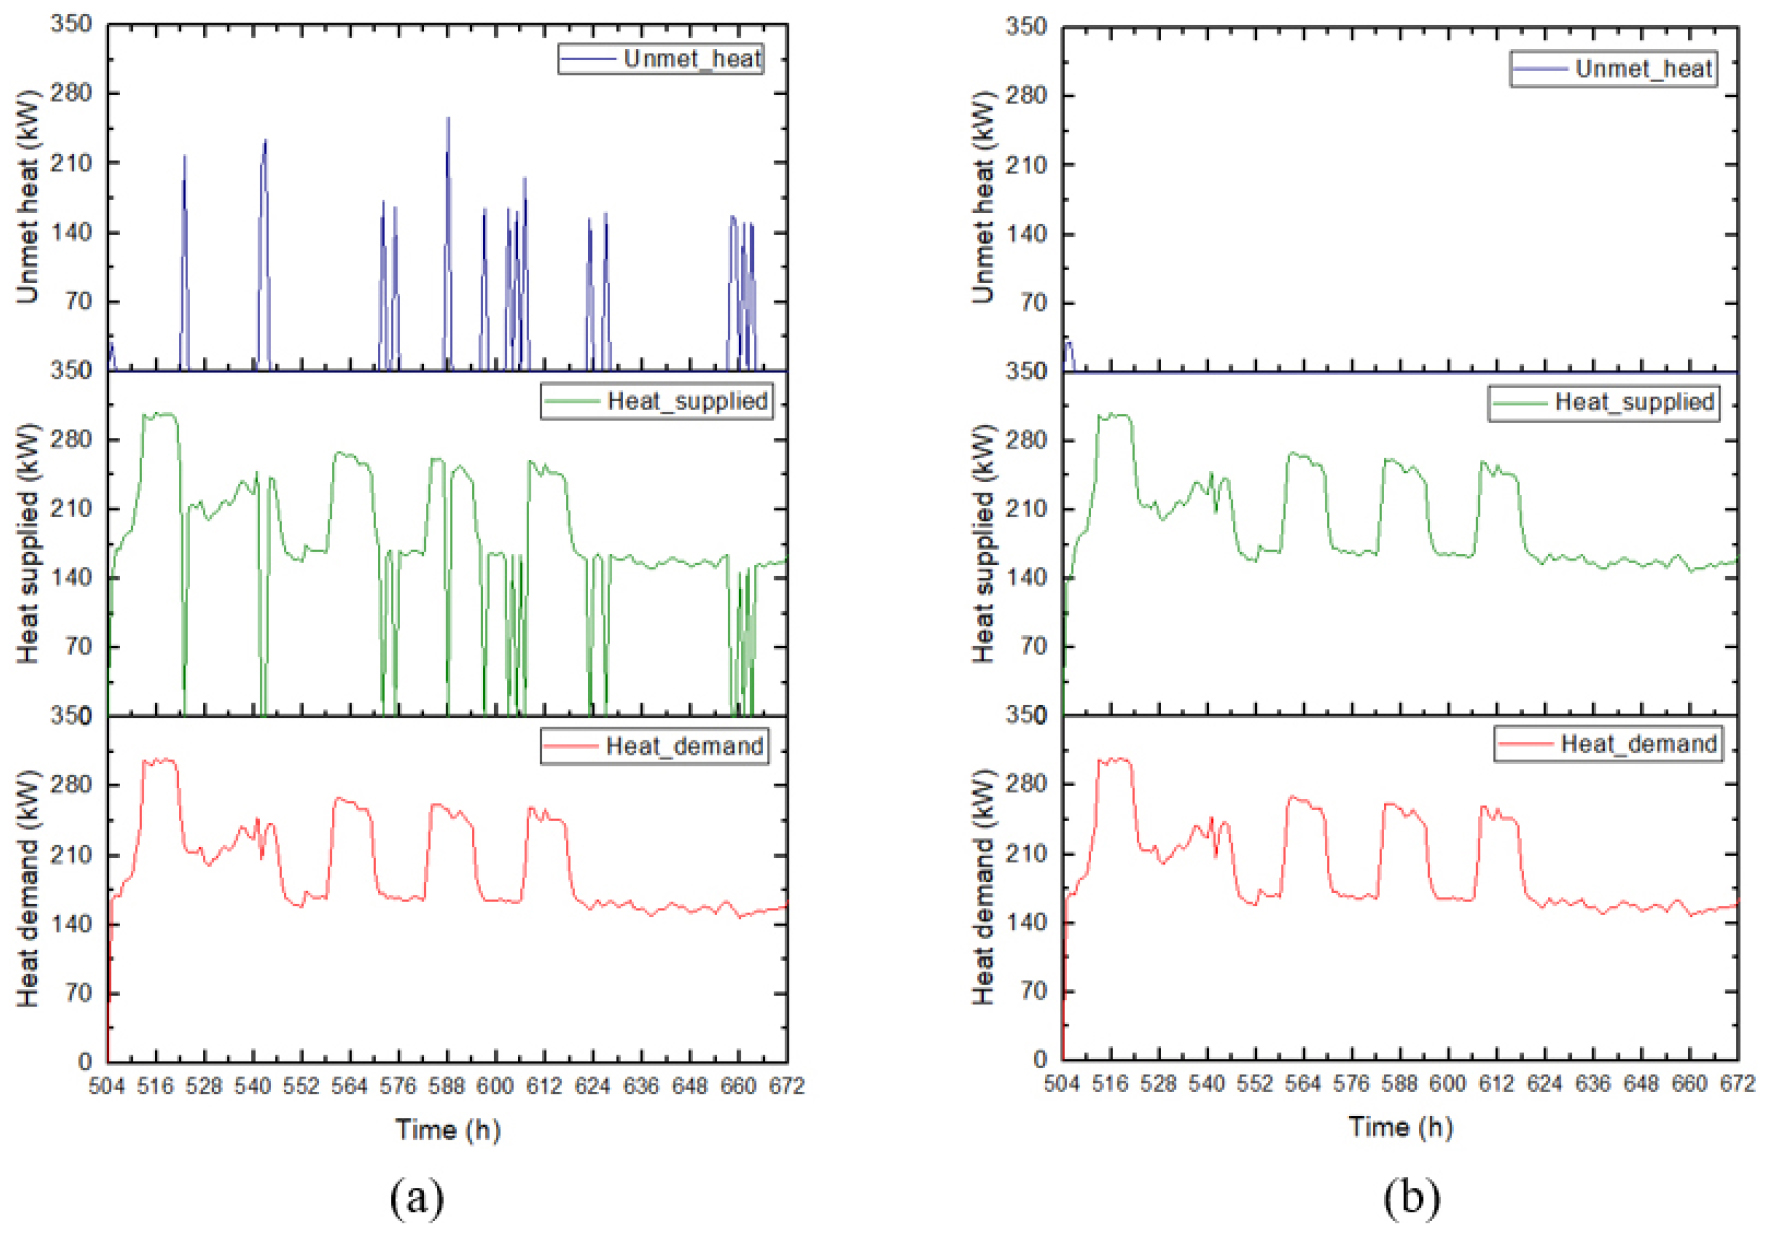
Fig. 9 presents the load coverage results for two MTHPa activation temperature thresholds. When the MTHPa activation temperature was set to 35℃, it coincided with the TES discharge stop threshold (35℃). Under this condition, the TES supplied heat until the top-node temperature decreased to 35℃, at which point discharge ceased. Simultaneously, the MTHPa attempted to activate at the same temperature, however, no further TES discharge was permitted below 35℃. This overlap resulted in an interruption of heat supply, leading to intermittent unmet load periods, as shown in Fig. 9(a).
By increasing the MTHPa activation threshold to 37℃, this overlap was eliminated, ensuring the TES discharge termination and MTHPa activation occurred at distinct temperature limits. As a result, unmet-load periods were eliminated over the entire representative week simulation, enabling continuous and stable operation, as illustrated in Fig. 9(b). These results demonstrate that small adjustments to temperature-based control thresholds can significantly enhance operational robustness in multi-mode P2H–TES systems, underscoring the importance of appropriate control parameters selection.
3.4 Heat-pump and fuel cell performance
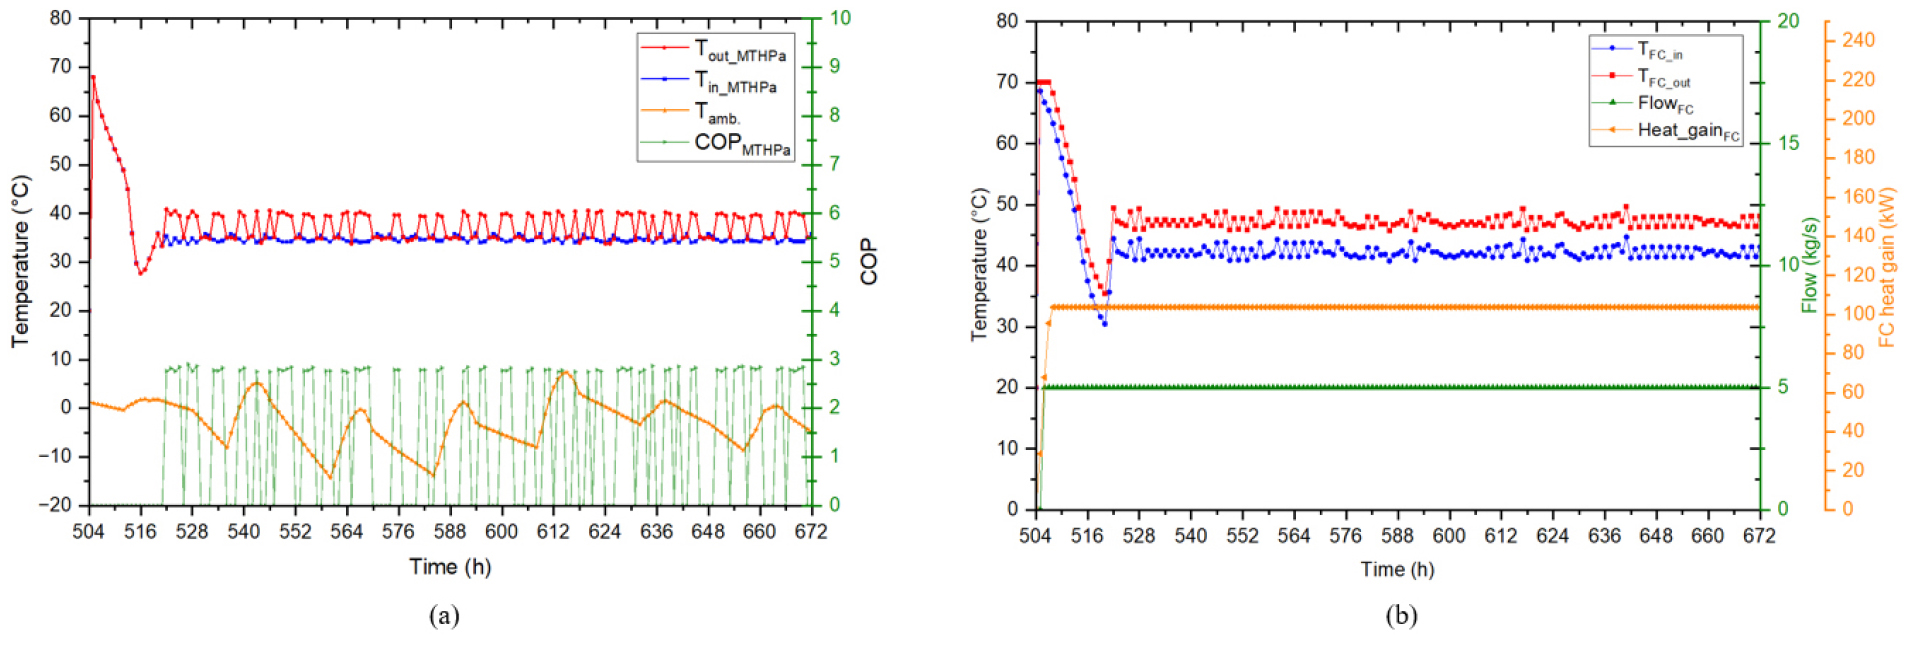
Fig. 10 illustrates the dynamic behavior of the MTHPa and fuel cell loop during the representative winter week simulation. Since the MTHPa activation threshold was set to 37℃, the units remained OFF during the initial TES discharging period. Once the TES top-node temperature dropped to this threshold, the MTHPa entered intermittent ON–OFF cycling, driven by TES temperature recovery. The corresponding COP variations reflect the heat pump operating state and remain centered around COP ≈ 3 as shown in Fig. 10(a). This behavior arises because the TRNSYS heat pump model employs the rated performance characteristics, and short-term COP fluctuations are primarily driven by ON-OFF cycling rather than continuous tracking of ambient air temperature. As a result, the sensitivity of COP to outdoor air temperature is smoothed. The fuel cell first prioritizes domestic hot water (DHW) supply and redirects waste heat to TES charging once the TES top-node temperature decreases to 65℃, thereby maximizing waste heat utilization. The fuel cell loop exhibited stable inlet and outlet temperatures and a nearly constant waste heat recovery rate throughout the simulation as shown in Fig. 10(b). This control strategy substantially improves fuel cell waste heat recovery and enhances overall system efficiency.
4. Conclusion
This study developed a multi-mode power-to-heat (P2H) thermal network integrating fuel cell waste heat, thermal energy storage (TES), and multiple heat pumps for a demonstration site. A TRNSYS-based dynamic model was constructed and simulated under representative winter thermal load conditions. The proposed control logic successfully enabled smooth transitions among TES charging, direct supply, parallel, and cascade operating modes while maintaining stable system performance. Clear TES stratification was preserved throughout the operating periods, confirming the suitability of the eight-node TES configuration for capturing vertical thermal gradients. Adjusting the MTHPa activation temperature from 35℃ to 37℃ eliminated unmet load periods, highlighting the critical role of appropriate tuned control parameters in P2H–TES systems.
The designed thermal network was able to fully supply a 300 kW thermal load for nearly three hours under direct supply operation, demonstrating strong potential to support –DR events. In addition, the coordinated operation of the TES and fuel cell can enhance the waste heat utilization compared to the current on site configuration, in which approximately 40% of the available heat is recovered. Overall, the results confirm that the proposed P2H–TES network can improve peak load management, increase on-site energy utilization, and enhance operational flexibility for building clusters. Building on these findings, future work will extend the analysis to full-year operating scenarios, explicitly incorporating on-site photovoltaic (PV) generation and electricity demand profiles to evaluate coordinated electric–thermal operation. Further efforts will focus on optimizing control parameters for demand response participation, quantifying energy-saving potential compared with conventional heating systems, and conducting techno-economic assessments and experimental validation following system installation.
