

1. Introduction
2. Meteorological Data
3. Methodology
3.1 Traditional Statistics
3.2 Bootsrap Method
3.3 Description of the Proposed Method
4. Results and Discussion
4.1 Probabilistic Prediction
4.2 Relative Error Analysis
5. Conclusion
1. Introduction
The design of a photovoltaic generation plant system strongly depends on the long-term weather dataset used to predict the long-term performance of the system. To achieve this goal, it is necessary to have a typical meteorological year or long-term weather dataset of the most frequent conditions at the relevant location, which allows a simulation of the solar power production supplied by the system over the long term. However, using a long-term weather dataset is time-consuming, inconvenient, and expensive compared to typical meteorological year1). To mitigate this problem, typical meteorological year datasets have been used with simulation tools such as PVSyst software to obtain photovoltaic output results quickly2).
Over the past few decades, many statistical methods have been used to calculate the time-series of the meteorological parameters of typical meteorological dataset. Lund's method is widely used in Europe3), while the Finkelstein-Schafer statistical method is well known in American publications. These statistical methods require a long-term measured weather dataset to generate TMY data for a given location4). Typical meteorological year datasets consist of 12 typical months determined by considering various meteorological elements, including global horizontal radiation and direct normal radiation as well as dry bulb temperatures, dew point temperatures, and wind speeds. However, some hourly measured weather datasets are found to be missing during the formation of the TMY due to a lack of observations; this gap can then be filled by statistical methods, satellite observations, and simulation algorithms5). Therefore, those interpolated datasets can reduce the accuracy of TMY datasets6). For this reason, the validation of TMY datasets is required, with an acceptable level of accuracy. In addition, stakeholders need TMY datasets with high accuracy to use them for solar project planning, as they translate directly into forecasts of electricity generation and revenues.
Previous studies7) have used deterministic methods to validate TMY data, though this method is limited and ignores the influence of uncertainty on the estimation of the TMY dataset. In such studies, error metrics and deterministic predictions were used to calculate error, simplified mean, variance, and standard deviation values, which are limited and cannot reflect the inherent integrated uncertainty8). Although these studies used deterministic methods, the corresponding statistical analyses generated unreliable means of values, suggesting that the TMY is not an appropriate tool for assessing individual sites to secure investments in long-term planning models and that risk levels associated with solar energy projects can be very high9).
Table 1 summarizes different studies of validation of TMY by using traditional statistics. However, for the practical design of renewable energy projects, it seems more appropriate to use probabilistic models than the deterministic approach, which is good for only one point in time10). Therefore, we adopted the bootstrap method as a probabilistic method to model the uncertainty of TMY data. As a result, the electrical energy produced by PV power generation system was estimated after the simulation of each TMY with prediction interval. In addition, this information is useful for long-term performance of the PV system in absence of the measurement of hourly weather data series, and further will enable the planners to make more informed decision11). The bootstrap method is frequently applied to make a probabilistic forecast in medicine, water assessment, and sustainable agriculture12). The main advantage of this method is that it is simple to use and generates samples from the given data. However, when the sample size n is very small, bootstrapping may fail.
Table 1
Summary of previous studies
| Period | Location | Methods | Validation | Findings | References |
| 1975-2008 | Nigeria |
Filkenstein Schafer method |
Deterministic approach |
TMY showed a good fit with long-term weather data with a mean percentage error of less than 2%. | Ohunakin et al. (2013)13) |
| 1999-2015 |
United State |
Filkenstein Schafer method |
Kolmogorov Smirnov Integral test (KSI) |
TMY datasets were less representative to the long-term energy production for Concentrated-PV systems. | Realpe et al. (2016)14) |
| 1971-2000 | Poland |
Filkenstein Schafer method |
Multi-criteria analysis method |
Finding showed that TMY were different from the long term average solar radiation. Author critiqued that TMY should not be considered as an appropriate alternative for the long-term measured data. | Nelken et al. (2015)15) |
| 2003-2014 | Portugal |
Filkenstein Schafer method |
Global Performance Index (GPI) |
TMY showed the closest results to the long-term weather datasets. | Abreu et al. (2018)16) |
Despite several studies validating TMY data at different locations, no study has focused on the bootstrap method to quantify the reliability or uncertainty of TMY datasets. In addition, the deterministic predictions used in the aforementioned studies are based on laws of physics that are too optimistic and provide an unreliable mean value that can be useless or even misleading. Furthermore, the impact of uncertainty in the estimates of the means and variance of TMY datasets was not taken into account despite the importance of providing information about uncertainty to those making long-term investment decisions related to solar energy systems. Therefore, this study assesses the bootstrap method for a quantitative analysis of the uncertainty of TMY datasets. The results will likely be widely used in feasibility studies and in policy decision-making activities in the solar power business in the future17).
There are three main objectives of this paper. Frist, we seek to estimate long-term PV electricity production levels from TMY and long-term measurement datasets. Second, the confidence interval for long-term electricity production and TMY electricity production will be established using the bootstrap method. Finally, the accuracy of TMY in estimating long-term PV electricity production levels will be evaluated. The validation method proposed in this study plays an important role in quantifying the prediction interval of the TMY in feasibility studies of solar energy projects. In addition, such information can help planners and investors to measure and manage risks and can assist with many decisions using TMY datasets in renewable projects.
2. Meteorological Data
To validate the TMY datasets, 31 sites were selected as study areas (Fig. 1) to analyze the effects of uncertainty in the TMY data. The TMY data (Finkelstein-Schafer statistical method) and historical year weather data (from 2008 to 2017) with the meteorological variables of the solar radiation, dry bulb temperatures and wind speeds are obtained from the New & Renewable Energy Resource Map database and from the Korea Meteorological Administration. The weather data is used as input for the simulation tool to study the performance of the photovoltaic system. Fig. 1 shows the geographical characteristics of the weather stations with the corresponding code, while Table 2 summarizes the selected locations.
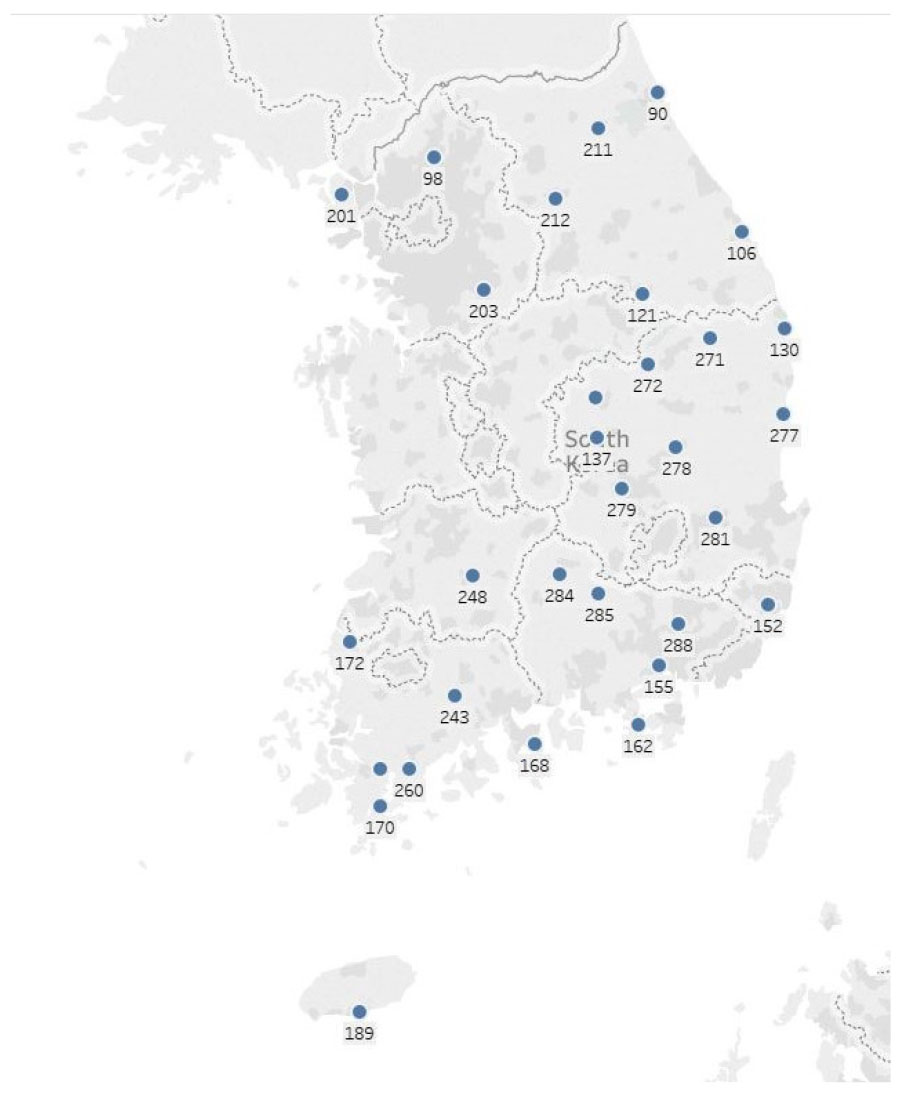
Table 2
Summary of selection sites
3. Methodology
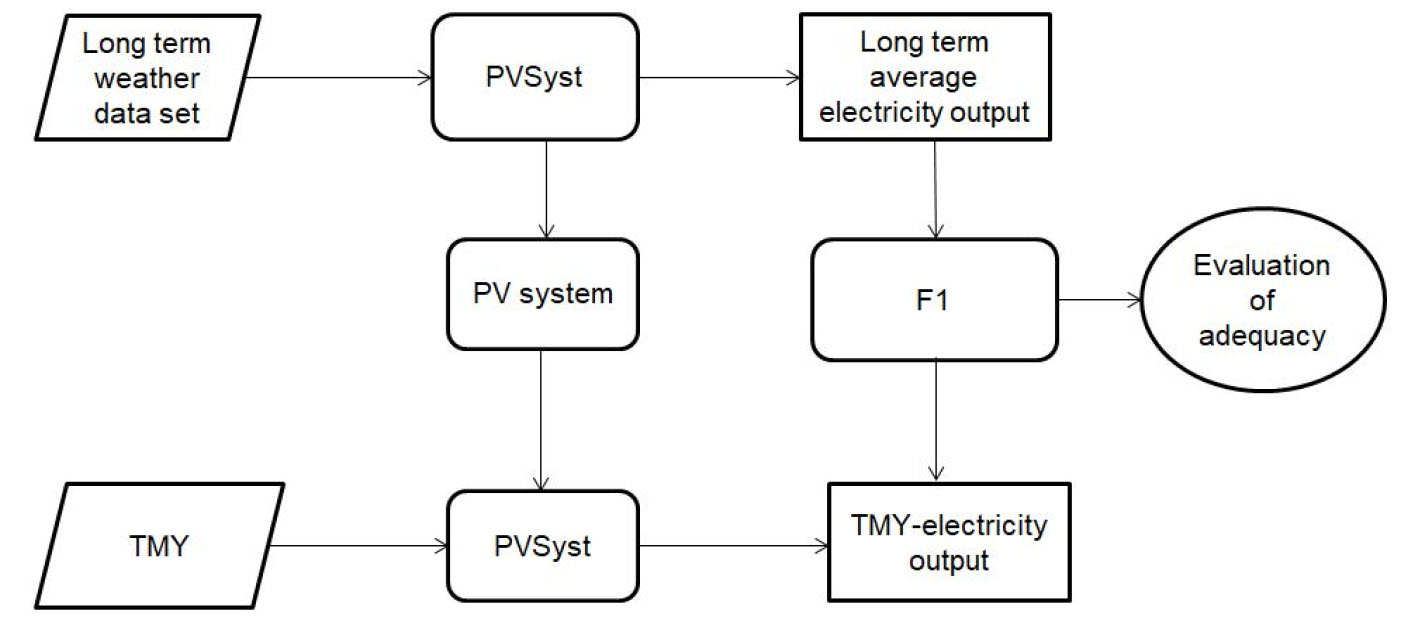
In order to assess the accuracy of the TMY dataset, a comparison was made between the TMY energy yield results and the multi-year average values after the simulation of the weather dataset in PVSyst software. The adequacy of the simulation tool was tested by means of the simulated electric energy production and measured electric energy outcome. The findings show that the error between PV energy production and simulated PV energy was close to 5%18). Long-term average weather datasets containing 8760 hourly irradiance, air temperature, wind direction, wind speed values and the TMY datasets were fed into the simulation tool to generate the long-term electrical power of the PV power generation system. The behavior of the TMY datasets was evaluated using a 100-kW PV system, where the modules of the system are arranged on a fixed plan array with an optimal tilt angle of 30 degrees and oriented on 0-degree azimuths facing south. After the simulation process, all annual hours of the energy yield results were transferred to a CSV file for further analysis. The long-term average electric energy production was used as a reference value to validate the TMY electric energy production using a probabilistic and deterministic model. The indicator F1, obtained from Equation 1, is the relative error percentage of the TMY annual average of the electrical energy produced by the PV power generation system and the long-term average; these values were used to underscore the errors. Fig. 2 shows the flowchart that was used to evaluate the accuracy of the TMY datasets.
The relative error percentage (REP):
where is an annual average electricity production of the long-term average, while is an annual average of electricity production of TMY.
3.1 Traditional Statistics
The use of traditional statistics is very common for the validation of TMY data. The most common descriptive statistics are the mean and standard deviation, which are used to describe the variability around the mean of a sample of a population. According to this approach, deterministic predictions cannot reflect uncertainty, and the risks can be very high in the economics of solar energy projects. However, in terms of statistics, uncertainty can be expressed as a 95% confidence interval from probabilistic modelling instead of a deterministic approach19).
3.2 Bootsrap Method
The bootstrap method, introduced and named by Efron in 1979, is used as a resampling technique to obtain information about the uncertainty of the estimates of means and variances in any confidence interval of any distribution20). The idea behind bootstrapping is to generate multiple datasets from an actual dataset without making any assumptions. This method can be used to generate a sample of the same size as the original dataset by randomly selecting actual observations one by one. In addition, it is a probabilistic simulation for decision making in uncertain situations. In this study, the bootstrap method was utilized to measure quantitatively the uncertainty of the estimation in terms of the mean values and confidence intervals of the annual average electrical energy production generated by the TMY and the historical year average. From a solar resource risk assessment perspective, it is critical to quantify the uncertainty in resource data. If the solar resource uncertainty is low, the PV system performance can then be relied upon with a higher level of confidence. Therefore, the uncertainty of probabilistic estimates represents crucial information in solar energy resource assessments, as it serves to mitigate risks in renewable energy projects.
The analysis process is presented below:
(1) Draw a new sample of size n with replacement from the original sample.
(2) Calculate the mean or variance of the new sample and refer to it as mi.
(3) Repeat steps 1 and 2, 10,000 times, calling the i-th new sample mean or variance mi.
(4) Plot the distribution of these 10,000 sample means or variances.
(5) Calculate the lower and upper bound of the 95% CI of mi as the 2.5% and 97.5% percentiles (P2.5 and P97.5) of the bootstrapped distribution derived from the histogram.
3.3 Description of the Proposed Method
The bootstrap method greatly contributes to the decision-making process of TMY data in solar project planning. In addition, it helps in evaluations of the uncertainty of TMY datasets in solar system feasibility studies21). The application of this method greatly increases the objectivity of the mean, variance and uncertainty analyses of TMY annual electrical energy production levels and long-term averages. The energy performance of a PV system was assessed using PVSyst software. Therefore, taking full advantage of the bootstrap method, an effective decision making method was used to determine the accuracy of TMY datasets to support the long-term planning of utility-scale PV generation at any site.
The main steps are given below:
Step 1: Simulation tool. Several types of data, including TMY and long-term weather data, as well as component specifications are entered into the PVSyst software. After the simulation process, the hourly electrical energy production values were exported as a CSV file, with a deterministic method then used to evaluate the accuracy of the TMY data
Step 2: Uncertainty analysis. The bootstrap method is utilized for different sites. In addition, the probability distribution for the annual average TMY electricity production and the long-term average was constructed with estimation uncertainty in the form of means and confidence intervals. Finally, the relative error was applied to analyze the difference between the long-term average electric power production and the TMY electric power production.
4. Results and Discussion
In this study, in order to assess the adequacy of the TMY datasets, the long-term average data and TMY of each weather station were simulated using PVSyst software. After the simulation, the annual average power output of the TMY was compared with the long-term average using two different methods, probabilistic and deterministic, to evaluate the uncertainty of the TMY data. Therefore, we undertook the calculation of the mean and standard deviation with the deterministic method (without considering sampling uncertainty) and the bootstrap method (considering sampling uncertainty) in the TMY power output and the long-term average power output.
To quantify the performance capabilities of the methods in terms of uncertainty, we initially analyzed the mean and standard deviation of deterministic statistics and probabilistic statistics to obtain a more reliable measure of the uncertainty. The uncertainty associated with TMY datasets is directly related to the long-term expected yield of solar PV systems22). Therefore, project investors must understand the accuracy of their TMY datasets. If the TMY uncertainty is lower than the long-term average electricity yield, predictions of long-term solar PV yields can then be based on TMY datasets with a high level of confidence.
Fig. 3 shows the calculation results of the standard deviation of the TMY-electricity output and the long-term average electricity for all sites when using the two aforementioned methods. As shown in Fig. 3, for most sites, a higher value is visualized for the mean and standard deviation as determined by traditional statistics compared to the 95% confidence intervals from the bootstrap method. As a result, the deterministic approaches did not provide reliable uncertainty estimates compared to the probabilistic approaches.
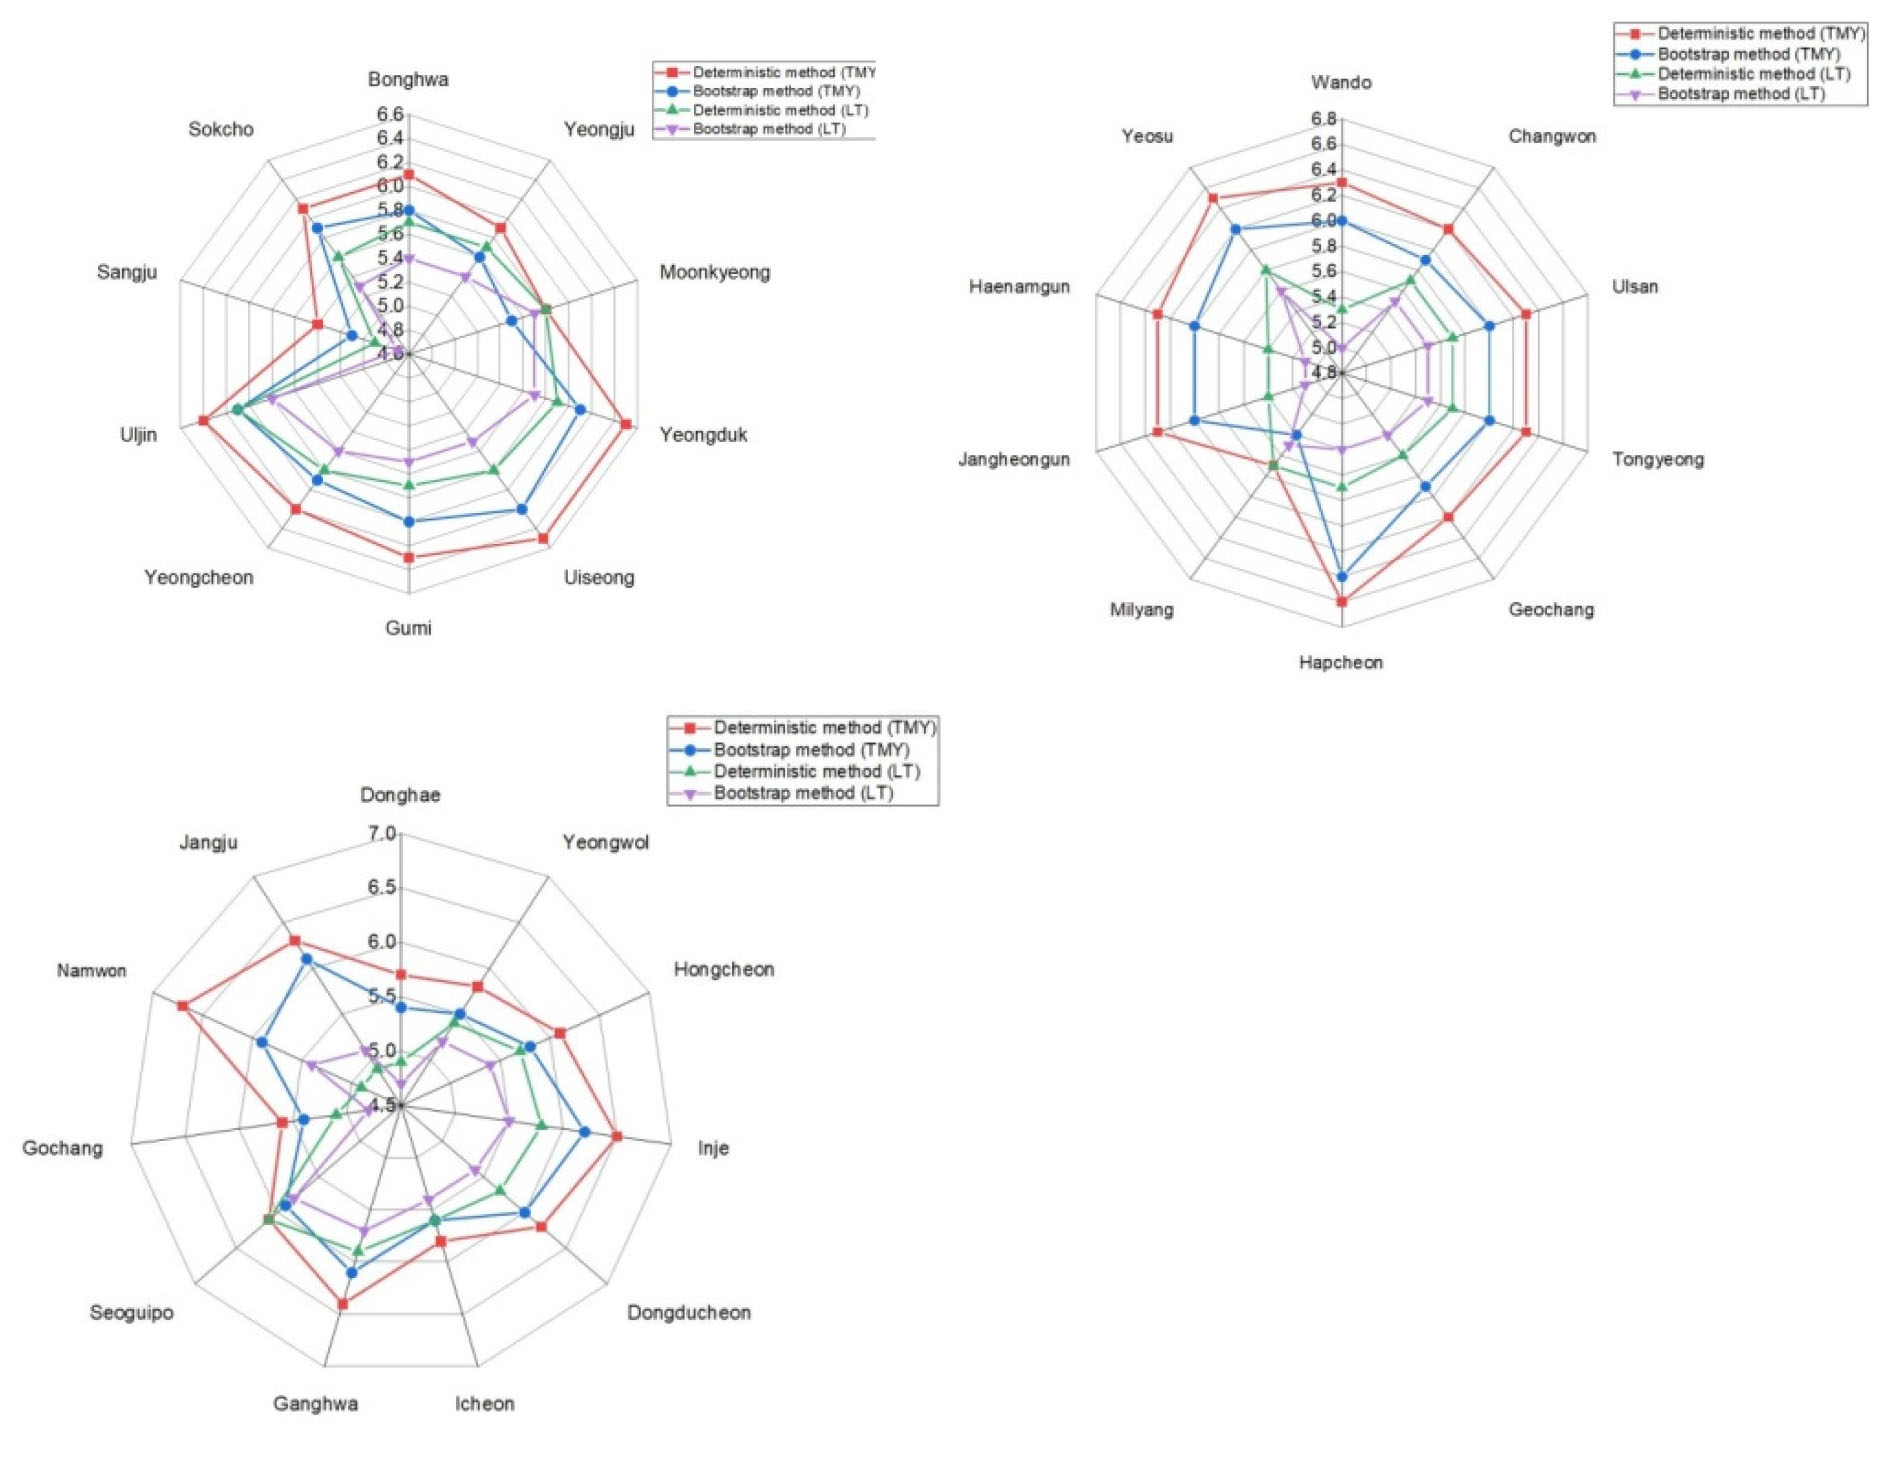
According to the deterministic values indicated in Fig. 3, there is deviation from the bootstrap approach based on the probabilistic approaches. The planning of a solar project with a deterministic model can lead to over- or under-investment in the financial viability of the solar energy project. However, by using the 95% distribution, PV developers can quantify the prediction interval of the TMY-electricity output and uncertainty in feasibility studies. Therefore, various interpretations by investors are possible with the probabilistic approaches; in addition, the results can clarify the expansion capacity of PV systems more precisely and effectively than a deterministic approach. The classification results of the standard deviation scores of the 31 weather stations in Fig. 3 were randomly selected.
4.1 Probabilistic Prediction
The uncertainty in the estimates of the average values of the TMY electricity output and the long-term average electricity were calculated in order to validate the TMY datasets using the bootstrap method (as described in Section 3). The bootstrap method shows a 95% confidence interval. First, the mean values (P50) and standard deviation of the probabilistic prediction of the TMY electricity output are compared with the mean values of the deterministic approaches. Therefore, the equality of means and the standard deviation between the TMY electricity output and the long-term average electricity output were utilized. All P50 standard deviations of the TMY annual average electricity are slightly smaller than those from the deterministic statistics for almost all sites because the TMY estimate from the bootstrap method in each case is already corrected by the iterative resampling method using the 95% bootstrap confidence interval. In particular, the bootstrap method reduces the errors by 2% to 4% in terms of the P50 standard deviation for all stations, where P50 indicates values are almost equal to those for the deterministic statistics for all sites. With lower uncertainty due to the bootstrap method, a higher level of performance can be assumed at all sites. For example, if a solar farm has an annual average estimated yield production of 10 kW with uncertainty ±10% at a prediction interval of 95%, the solar farm would then produce only 9 kW at the low end of the uncertainty. If the uncertainty is ±5%, the solar farm would produce 9.5 kW. The 9 or 9.5 kW would then be used to estimate the debt fraction. With lower uncertainty, the estimate of the return on equity would increase.
In the TMY electricity output case when using the bootstrap method, Fig. 3 shows that this approach indicates variability closer to the long-term average, meaning that the TMY data offers good performance in predictions of the electricity output. This information could be useful to measure and manage risk and will help those who must make many decisions using TMY datasets in renewable projects. In addition, the mean value and confidence interval (P2.5 and P97.5) of the TMY electricity output have values close to the long-term average with the least uncertainty.
These results reveal that the deterministic prediction can underestimate or overestimate the true mean value of a TMY in estimations of the electrical energy produced by a PV power generation system, mainly because this approach neglects the sampling uncertainty21). As a result, future revenue values would decrease with high risk. The comparison of the two methods with regard to the TMY and the long-term average PV power output shows that the bootstrap method provides a more reliable credibility range for the mean value. Furthermore, the method proposed in this work can be used to analyze the uncertainty of TMY datasets quantitatively, and it is believed that it can be widely used for mitigating the risks of the solar power projects in the future.
4.2 Relative Error Analysis
The impact of uncertainty in the TMY data was evaluated using two different methods (deterministic and probabilistic prediction) with a comparison of the relative error of the annual average value of the TMY and the long-term electric energy production outcome. Fig. 4 presents the relative error percentage for each method. The relative error was used to validate the TMY electricity output calculated by the two methods. Fig. 4 illustrates the calculation results of the relative error percentage (REP) at different locations. It can be seen that the REP outcomes are wholly different for two methods, except for the Uljin and Icheon sites. The difference is mainly due to deterministic method itself, as it neglects the effect of sampling uncertainty on the estimations of the average and standard deviation. Furthermore, it gives a single outcome, while the bootstrap method incorporates the uncertainty explicitly in the mean value and variance. Therefore, it offers a confidence interval of the possible outcomes of the model.
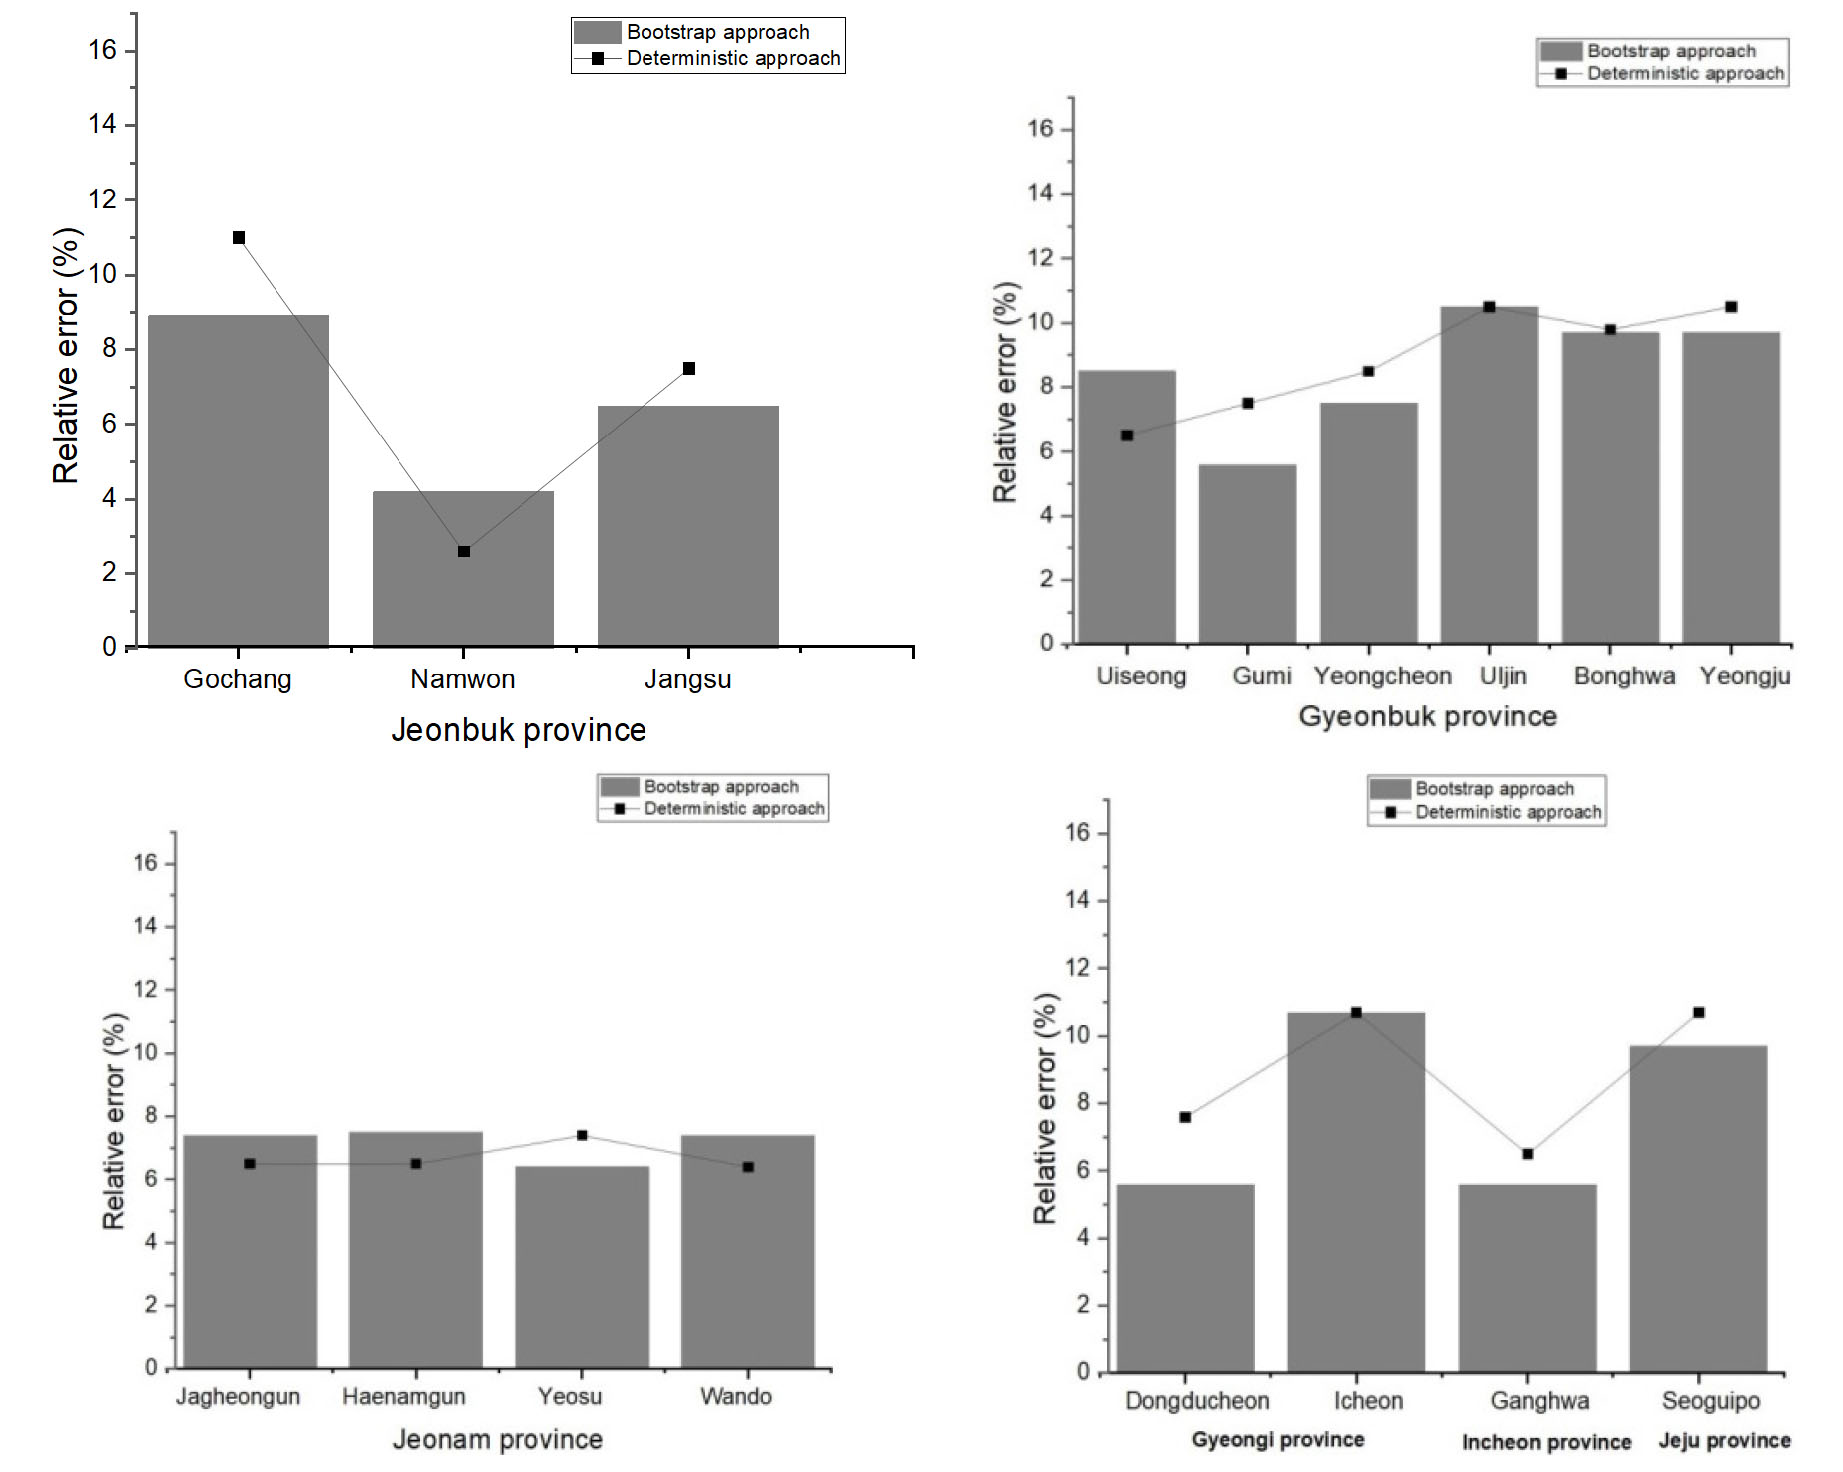
The error percentages according to the deterministic method (Fig. 4) at Yeongju, Gumi, Yeongcheon, Dongducheon, Ganghwa, Seoguipo, Gochang, Jongsu, and Yeosu site appeared to be higher than the probabilistic estimates. In addition, this approach had limitations that may lead to underestimations or overestimations of the mean and standard deviation of the TMY electricity output because it does not consider the uncertainties caused by missing data. However, knowledge of the accuracy and uncertainties of TMY data is very important for debt financing of a solar energy project. Thus, higher uncertainty levels would affect the estimated performance of the electricity output as well as financial investments of the solar energy project. In contrast, the probabilistic method was found to be very useful as it provided a valid and informative estimate of the long-term feasibility of the photovoltaic system.
It is significant that the error metrics calculated in other studies using deterministic models tend to have the same values according to the data, as shown in Table 3.
Table 3
Summary of validation of TMY datasets in other studies using the deterministic method
| Location | The difference between TMY and long term average. | References |
| Beijing | 4% | Jiang et al. (2010)23) |
| Hongkong | 4.14% | Chan et al. (2016)24) |
| Thailand | 5% | Pattarapanitchai et al. (2014)25) |
The bootstrap method can provide not only the expected estimate but also the prediction interval, which can be used to analyze the uncertainty of the TMY for estimating the electric energy produced by a PV power generation system in the long term. The deterministic approach can increase the expectation of the profitability of energy output in a solar power project. This may affect the renewable energy tax credit that is applied based on the amount of energy produced. From the above discussions, it is clear that uncertainty analyses of TMY datasets should be based on the bootstrap method (probabilistic prediction) rather than on deterministic predictions.
5. Conclusion
Evaluations of solar projects planning require high accuracy of the TMY datasets. Therefore, we designed a photovoltaic system in the PVSyst simulation tool to test the adequacy of TMY datasets. Furthermore, two statistical methods, in this case deterministic and probabilistic methods, were compared by evaluating the uncertainties in TMY datasets. In general, the probabilistic method provides more accurate results than the deterministic method. The uncertainty was evaluated by comparing the annual means and variances of TMY electricity production and the long-term average electricity production. The bootstrap method was utilized to analyze the uncertainties of TMY datasets in a feasibility study of a solar energy system using 95% confidence intervals, which provided both valid and more informative estimates than the deterministic prediction.
The main important findings are summarized below.
(1) The uncertainty in the estimates of the variances was quantified by calculating the 95% confidence intervals of the TMY and the long-term average electricity output at all stations. The results showed that the probabilistic prediction of the TMY was close to the long-term average electricity output at all sites. Furthermore, compared to the deterministic prediction, the bootstrap method provides the uncertainty value at the 95% confidence level, which can be used to estimate the debt fraction of a solar energy project. A proper understanding of uncertainty in TMY datasets is a fundamental element for ensuring competitive financing of solar energy projects.
(2) The bootstrap method presented in this paper considers a proper assessment of the uncertainty in the TMY dataset used for a solar energy system to obtain reliable results, and it is advisable to express the uncertainty as a prediction interval in statistics. In addition, the annual average TMY electricity output estimate with the confidence interval will be useful in a solar energy resources assessment and can help planners and investors to use TMY datasets more confidently in renewable energy deployment decision, also likely playing a crucial role in mitigating the risk of renewable energy projects.
The policy implications of this research are several. First, the results of this research can serve as advice for project planners as they conduct studies of the long-term feasibility of solar energy projects with TMY datasets. Second, the uncertainty analysis of TMY datasets developed by the bootstrap method can help in the decision-making process when weather datasets are missing. Thirdly, Korean policymakers should encourage the use of TMY datasets in PV system design projects because these datasets can reduce the computational burden and save time. In addition, in the future, the bootstrap method with the confidence interval of the TMY electricity output will help those involved in evaluations of the uncertainty in the economic performance of solar energy systems in terms of the levelized cost of energy and the net present cost.
